
按块创建线性回归
按块创建线性回归
提问于 2018-04-26 00:32:30
生成函数sin (x) + 2;的25点
xS = linspace (0.2 * pi, 25);
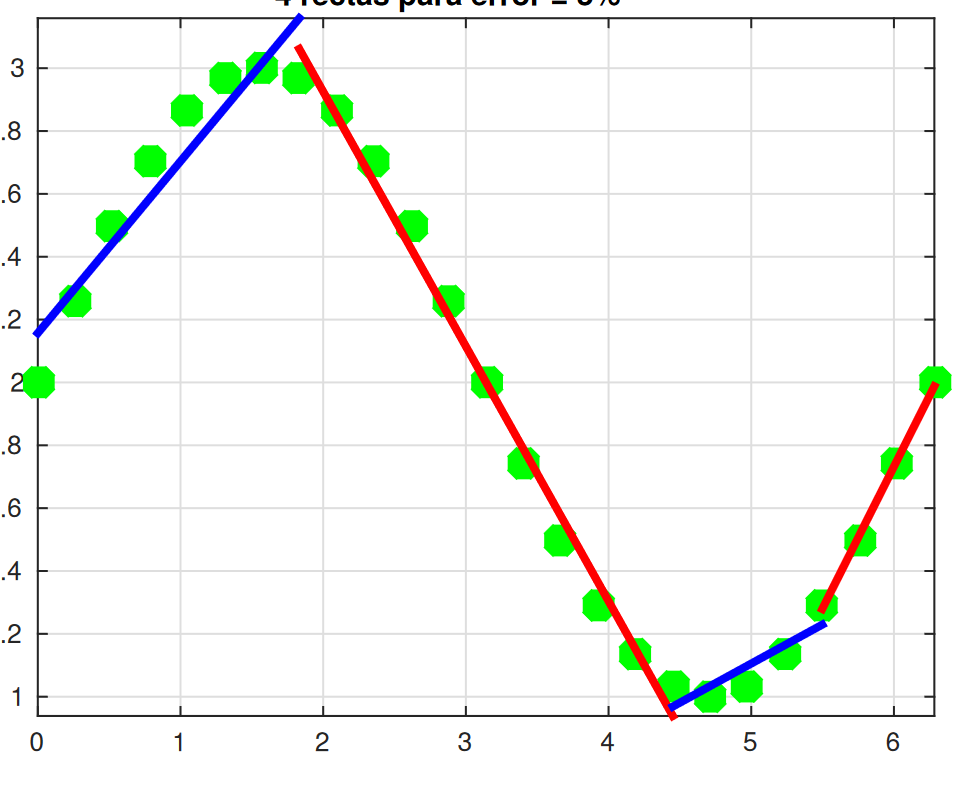
yS = sin (xS) + 2;找出在间隔内调整前一条曲线的线,使每个区间中的误差小于5%。把它们画在要点旁边。
有人能帮我做这个节目吗?
我的节目:
线性回归函数:
function [m,b,error, yApp]=f_regresionLineal(x,y)
xp = mean(x);
yp = mean(y);
n = length(x);
m = ( sum(x.y) -nxpyp )/( sum(x.^2)-nxp^2 );
b = yp-m*xp;
yApp = m*x+b;
error = mean(abs(y-yApp)./y);
end
剧本:
S = linspace(0,2*pi,25);
yS = sin(xS)+2;
plot(xS,yS,'r*')
grid on
axis tight
hold on

xxS=xS(1:8);
yyS=yS(1:8);
[m,b,error, yApp]=f_regresionLineal(xxS,yyS)
hold on;
plot(xxS,yApp,'b');

xxS=xS(8:18);
yyS=yS(8:18);
[m,b,error, yApp]=f_regresionLineal(xxS,yyS)
hold on;
plot(xxS,yApp,'g');

xxS=xS(18:22);
yyS=yS(18:22);
[m,b,error, yApp]=f_regresionLineal(xxS,yyS)
hold on;
plot(xxS,yApp,'k');

xxS=xS(22:25);
yyS=yS(22:25);
[m,b,error, yApp]=f_regresionLineal(xxS,yyS)
hold on;
plot(xxS,yApp,'y');回答 1
Stack Overflow用户
回答已采纳
发布于 2018-04-26 01:47:37
首先,我必须说,你的代码中有这么多的排字.
第二,在我看来,分段线性回归是适合您需要的方法(对不起,但我不确定这个方法的英文名称是否正确)。
一些计算:
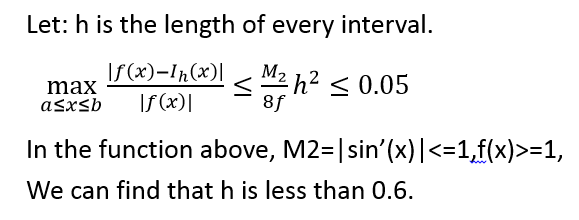
所以我们选择每三个点拟合一个线性函数。
第三,下面的代码是您的一些扩展:
f_regresionLineal.m
function [m,b,error, yApp]=f_regresionLineal(x,y)

xp = mean(x); yp = mean(y); n = length(x);

m = (sum(x.*y)-n*xp*yp)/(sum(x.^2)-n*(xp^2));

b = yp-m*xp;

yApp = m*x+b; error = mean(abs(y-yApp)./y);

end
剧本:
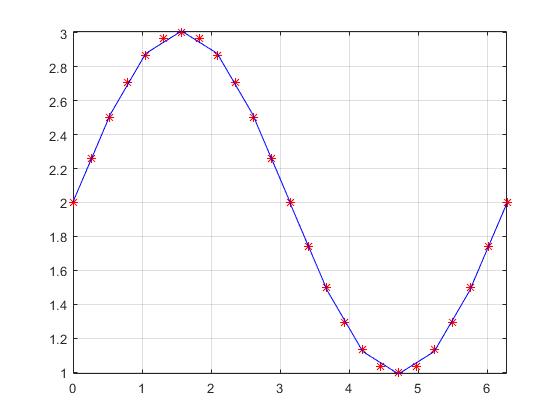
clc; clear;
xS = linspace(0,2*pi,25)'; yS = sin(xS)+2;

plot(xS,yS,'r*');
grid on
axis tight
hold on

L=1:2:length(xS);
for ii=2:length(L)
  xxS=xS(L(ii-1):L(ii));
  yyS=yS(L(ii-1):L(ii));
  [m,b,error, yApp]=f_regresionLineal(xxS,yyS);
  plot(xxS,yApp,'b');
end
输出:
页面原文内容由Stack Overflow提供。腾讯云小微IT领域专用引擎提供翻译支持
原文链接:
https://stackoverflow.com/questions/50033129
复制相关文章
相似问题
腾讯云开发者

Copyright © 2013 - 2026 Tencent Cloud. All Rights Reserved. 腾讯云 版权所有
深圳市腾讯计算机系统有限公司 ICP备案/许可证号:粤B2-20090059 ![]() 粤公网安备44030502008569号
粤公网安备44030502008569号
腾讯云计算(北京)有限责任公司 京ICP证150476号 | 京ICP备11018762号