
带有多个y的3个子图的Sharex
带有多个y的3个子图的Sharex
提问于 2018-04-20 10:37:16
基本上,我想把3个图叠在一起,这样他们就可以共享x了。因为他们有两个或更多的y轴。
如果不清楚我的意思是什么,我会手动把图表放在一起,看看它的外观,但并不是很好。(注意/忽略图表上的线条,我也希望在1或2上有无x标签)
此外,下面显示了其中一个数字代码的示例--如果有帮助的话。
fig = plt.figure()
ax = plt.subplot2grid((2, 2), (0, 0), rowspan=2, colspan=2)
fig.subplots_adjust(left=0.13, bottom=0.12, right=0.91, top=0.9, wspace=0.3,
hspace=0.5)
plt.margins(x=0)

ax.scatter(data['elapsed_seconds'], Abut_Stress, label='Abutment Stress
Calculated', linewidth=0, marker='o', s=20,
       c='k')

ax.plot(data['elapsed_seconds'], data['wheel_temp_c'], label='Wheel
Temperature', linestyle="-", color='b')
ax.plot(data['elapsed_seconds'], data['abut_temp_c'], label='Abutment
Temperature', linestyle="-", color='g')
ax2 = ax.twinx()
ax2.plot(data['elapsed_seconds'], data['wheel_speed'], label='Wheel Speed',
linestyle="-", color='r')

# -------------Get legend names to be plotted in the same legend box-------

h1, l1 = ax.get_legend_handles_labels()
h2, l2 = ax2.get_legend_handles_labels()
lg = ax.legend(h1 + h2, l1 + l2, bbox_to_anchor=(0., 0.8, 1., .102), loc=3,
ncol=1, borderaxespad=0., fontsize=28, )
lg.get_frame().set_linewidth(0.5)

# ----------------------Settings for the first figure window---------------

ax.set_ylim(0, 1000)
ax2.set_ylim(0, 12)
ax.set_xlim(0,data_end)
ax.set_xlabel(r"Time (s)")
ax.set_ylabel(r"Abutment Stress (MPa)    Temperature($^\circ$C)")
ax2.set_ylabel(r"Wheel Speed (RPM)")

ax.get_xaxis().tick_bottom()
ax2.get_xaxis().tick_bottom()回答 1
Stack Overflow用户
回答已采纳
发布于 2018-04-20 11:58:17
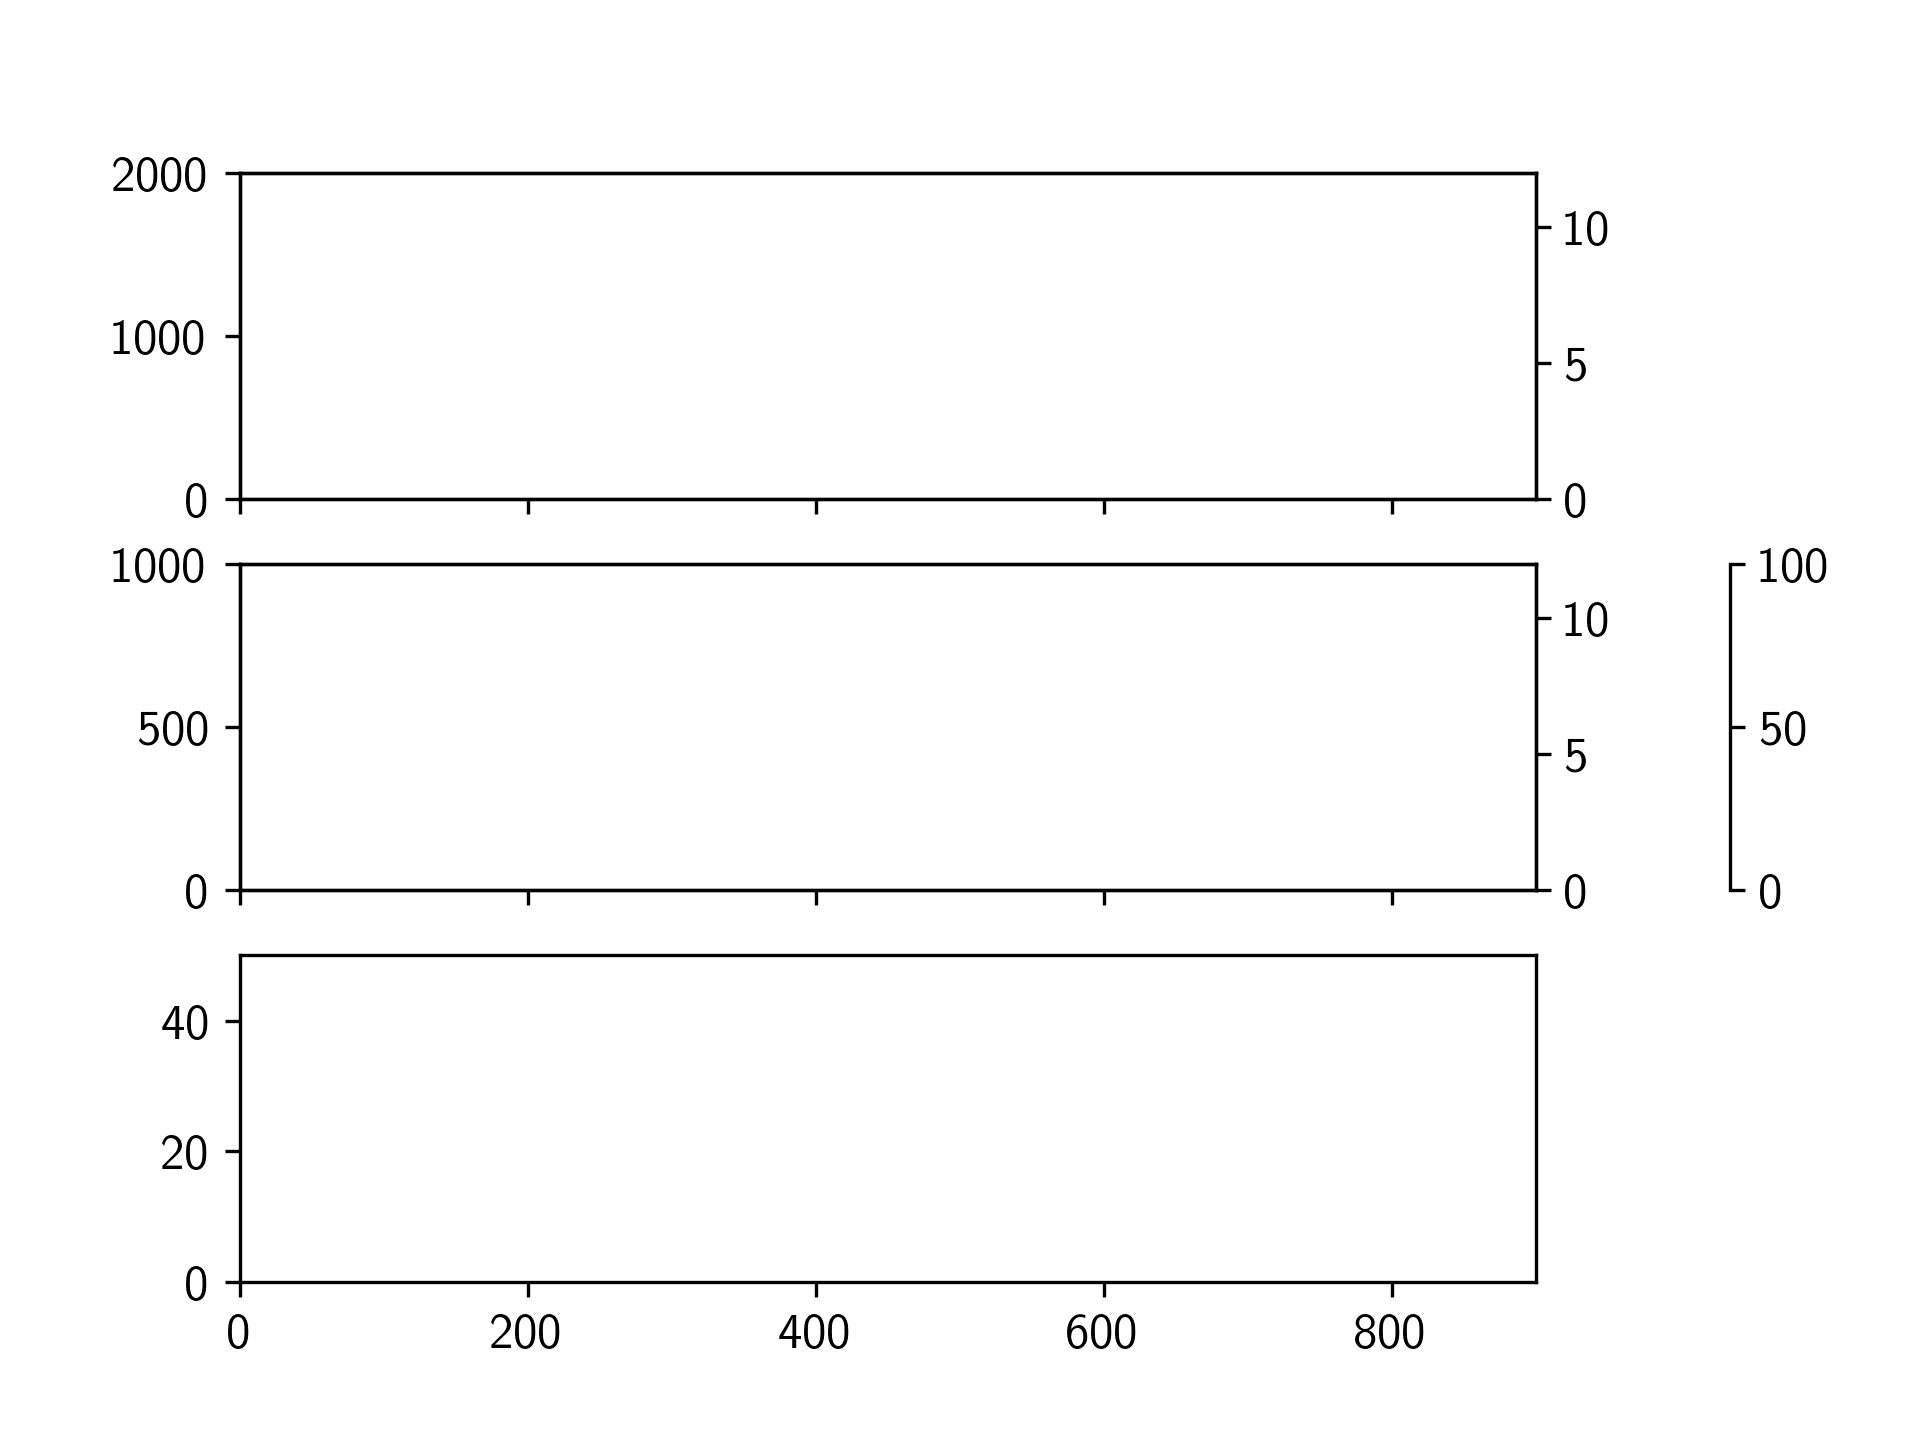
这里有一个简单的脚本来做你想做的事情。它使用plt.subplots创建具有共享xaxis的前三个轴,然后使用ax.twinx创建双轴。
在一个共享轴上的偏移脊柱是使用matplotlib库上的这个示例完成的。
import matplotlib.pyplot as plt

def make_patch_spines_invisible(ax, offset):
    '''
    This function inspired by this example, to offset a twin axis spine.
    link: https://matplotlib.org/gallery/ticks_and_spines/multiple_yaxis_with_spines.html
    '''
    ax.spines["right"].set_position(("axes", offset))
    ax.set_frame_on(True)
    ax.patch.set_visible(False)
    for sp in ax.spines.values():
        sp.set_visible(False)
    ax.spines["right"].set_visible(True)

# First create your figure, with 3 subplots sharing the x axis.
fig, (ax1, ax2, ax3) = plt.subplots(nrows=3, sharex=True)

# make some room on the right for the twin axes
fig.subplots_adjust(right=0.8)

# The easy ones, create the first twin axes on ax1 and ax2
ax1t = ax1.twinx()
ax2t = ax2.twinx()

# Create the twin axis on ax2 with an offset spine
ax2tb = ax2.twinx()
make_patch_spines_invisible(ax2tb, offset=1.15)

# Here I just set some axes limits to show the y axis scales are all independent
ax3.set_xlim(0, 900)

ax1.set_ylim(0, 2000)
ax2.set_ylim(0, 1000)
ax3.set_ylim(0, 50)

ax1t.set_ylim(0, 12)
ax2t.set_ylim(0, 12)
ax2tb.set_ylim(0, 100)

plt.show()
页面原文内容由Stack Overflow提供。腾讯云小微IT领域专用引擎提供翻译支持
原文链接:
https://stackoverflow.com/questions/49939738
复制相关文章
相似问题
腾讯云开发者

Copyright © 2013 - 2026 Tencent Cloud. All Rights Reserved. 腾讯云 版权所有
深圳市腾讯计算机系统有限公司 ICP备案/许可证号:粤B2-20090059 ![]() 粤公网安备44030502008569号
粤公网安备44030502008569号
腾讯云计算(北京)有限责任公司 京ICP证150476号 | 京ICP备11018762号