
Cartopy set_extent不工作
Cartopy set_extent不工作
提问于 2018-04-12 21:30:47
我试图使用Mateplotlib cartopy来制作下面的情节。这是我正在使用的代码。
import cartopy.crs as ccrs

fig=plt.figure(figsize=(15,11))
ax = plt.subplot(111, projection=ccrs.PlateCarree(central_longitude=0))
mm =   ax.contourf(new_lon[:],lat_post,new_aa[0,:,:],transform=ccrs.PlateCarree(central_longitude=0))

ax.coastlines(resolution='10m');
ax.stock_img();
# the following two lines increaes the vertical distance between the title and the upper tick.
from matplotlib import rcParams
rcParams['axes.titlepad']=20
# drawing the longitude and latitude ticks.
gl = ax.gridlines(crs=ccrs.PlateCarree(central_longitude=0), draw_labels=True,linewidth=2, color='gray', alpha=0.5, linestyle='--')
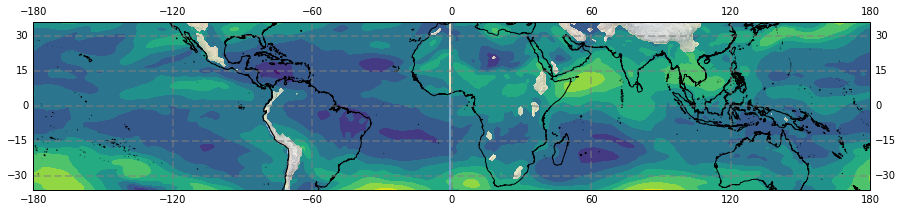
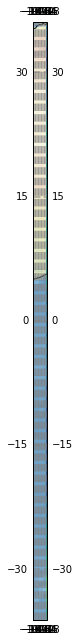
然而,一旦我添加了下面的代码set_extent ax.set_extent([np.min(new_lon),np.max(new_lon),np.min(lat_post) ,np.max(lat_post)])
这些数字会变成那样
回答 1
Stack Overflow用户
回答已采纳
发布于 2018-04-13 03:19:59
看你的原始地图,它看起来像是在0经度处有一个缝,所以我猜np.min(new_lon)是0,np.min(new_lon)是360。如果你把它和set_extent()一起使用,你会得到一个非常窄的条条,在主子午线上。我想如果你做set_extent([-180, 180, ,np.min(lat_post), np.max(lat_post)]的话,效果会更好。
在这种情况下,我认为以编程方式实现它的唯一方法是:
lon_bounds = new_lon[:]  # copy
lon_bounds[lon_bounds > 180] -= 360
ax.set_extent([np.min(lon_bounds), np.max(lon_bounds), np.min(lat_post), np.max(lat_post)])页面原文内容由Stack Overflow提供。腾讯云小微IT领域专用引擎提供翻译支持
原文链接:
https://stackoverflow.com/questions/49806184
复制相关文章
相似问题
腾讯云开发者

Copyright © 2013 - 2026 Tencent Cloud. All Rights Reserved. 腾讯云 版权所有
深圳市腾讯计算机系统有限公司 ICP备案/许可证号:粤B2-20090059 ![]() 粤公网安备44030502008569号
粤公网安备44030502008569号
腾讯云计算(北京)有限责任公司 京ICP证150476号 | 京ICP备11018762号