
根据趋势行为在ggplot2上添加标签
根据趋势行为在ggplot2上添加标签
提问于 2018-04-09 18:59:23
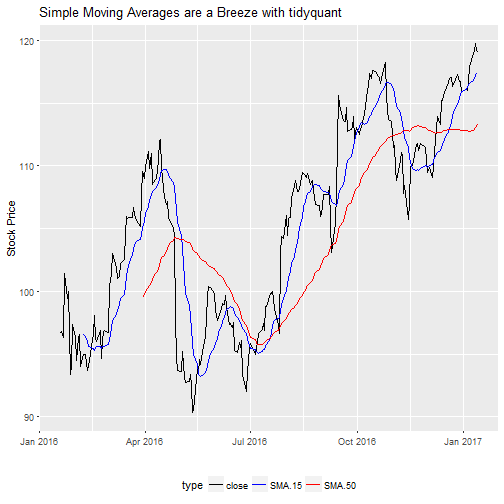
我有一个时间序列,并根据股票价格计算了两个趋势。当SMA.15 (蓝线)交叉SMA.15 (红线)时,我试图在地块上添加像˄这样的标签
AAPL %>%
    select(date, close, SMA.15, SMA.50) %>%
    gather(key = type, value = price, close:SMA.50) %>%
    ggplot(aes(x = date, y = price, col = type)) +
    geom_line() +
    theme(legend.position="bottom") +
    ggtitle("Simple Moving Averages with tidyquant") +
    xlab("") +
    ylab("Stock Price")
回答 1
Stack Overflow用户
发布于 2018-04-09 21:04:42
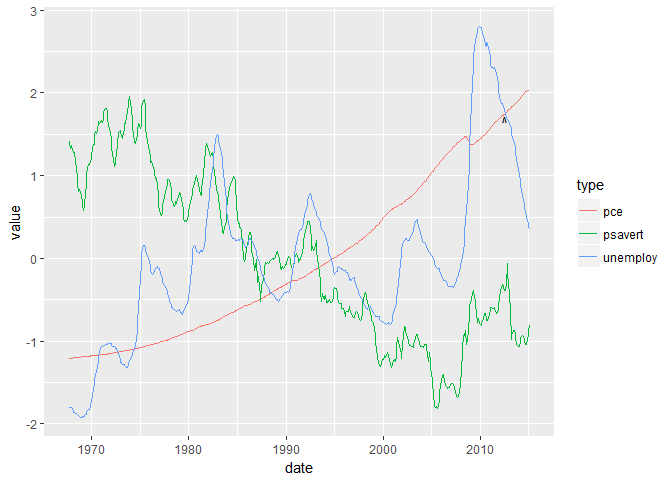
下面是一个使用ggplot2::economics数据集的示例。我标尺的数值,所以他们是有意义的绘制在一起,并平滑的滚动平均值。然后,通过查找变量接近的日期,可以看到一些候选交叉口。在这里,我选择第二行,并添加一个小的y调整,所以^是指向交叉口,而不是在它的顶部。
library(tidyverse)
ts <- economics %>%
  mutate_at(vars(psavert, pce, unemploy), ~ `attributes<-`(scale(.), NULL)) %>%
  mutate_at(vars(psavert, pce, unemploy), ~ RcppRoll::roll_mean(., 5, fill = NA)) %>%
  select(date, psavert, pce, unemploy)

pts <- ts %>%
  mutate(diff = abs(pce - unemploy)) %>%
  arrange(diff)
head(pts, 3)
#> # A tibble: 3 x 5
#>   date       psavert     pce unemploy     diff
#>   <date>       <dbl>   <dbl>    <dbl>    <dbl>
#> 1 1988-07-01 -0.0181 -0.415   -0.415  0.000596
#> 2 2012-08-01 -0.383   1.75     1.76   0.00191
#> 3 1994-09-01 -0.530  -0.0122  -0.0180 0.00577

ggplot(ts %>% gather(type, value, psavert:unemploy)) +
  geom_line(aes(x = date, y = value, col = type)) +
  annotate("text", x = pts$date[2], y = pts$pce[2] - 0.1, label = "^")
#> Warning: Removed 12 rows containing missing values (geom_path).
由reprex封装创建于2018-04-09 (v0.2.0)。
页面原文内容由Stack Overflow提供。腾讯云小微IT领域专用引擎提供翻译支持
原文链接:
https://stackoverflow.com/questions/49739878
复制相关文章
相似问题
腾讯云开发者

Copyright © 2013 - 2026 Tencent Cloud. All Rights Reserved. 腾讯云 版权所有
深圳市腾讯计算机系统有限公司 ICP备案/许可证号:粤B2-20090059 ![]() 粤公网安备44030502008569号
粤公网安备44030502008569号
腾讯云计算(北京)有限责任公司 京ICP证150476号 | 京ICP备11018762号