
如何在matlab中绘制三维垂直平面
如何在matlab中绘制三维垂直平面
提问于 2018-04-03 20:19:48
我有一个函数f(x,y)
f(x,y) = h(x,y),若x<-0.5
f(x,y) = g(x,y),if -0.5<=x<0
f(x,y) = k(x,y),若x-y>=0
我想在3D空间(x,y,z)上画这个图,其中z代表f(x,y)的值。另外,我还想生成像x= -0.5,x=0这样的垂直平面,并在相同的3D空间中绘制它们,这样我就可以看到f(x,y)在(x,y)不同区域的变化。我如何在matlab中将这些绘制在一个3D图中?
回答 1
Stack Overflow用户
回答已采纳
发布于 2018-04-03 21:02:14
您首先需要生成一个由x和y点组成的网格,用于评估您的函数f(x,y)。您可以使用meshgrid来完成这个任务。例如,这将为x和y创建从-1到1的201×201点网格。
[x, y] = meshgrid(-1:0.01:1);现在您可以用z的结果填充矩阵f(x,y),使用逻辑索引在网格点的不同子集上计算每个部分。
z = 5.*x+4.*y;                       % Use g(x,y) as default fill value
index = ((x-y) < -0.5);              % Logical index of grid points for h(x,y)
z(index) = x(index).^2+y(index).^2;  % Evaluate h(x,y) at index points
index = ((x-y) >= 0);                % Logical index of grid points for k(x,y)
z(index) = x(index).*y(index); % Evaluate k(x,y) at index points现在您可以使用z来绘制surf。
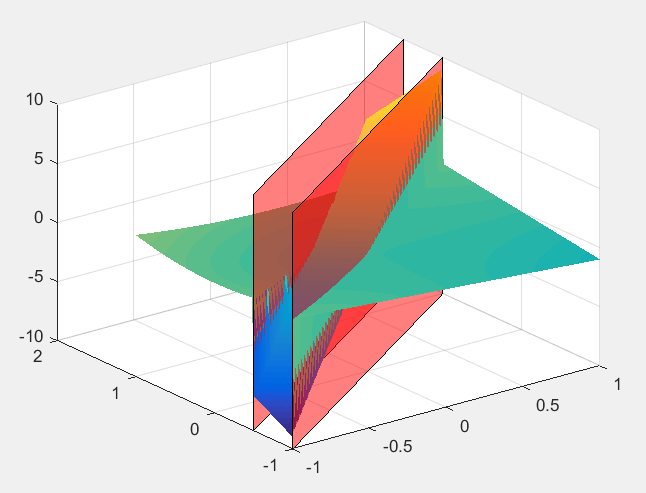
surf(x, y, z, 'EdgeColor', 'none'); % Plots surface without edge lines然后,您可以为这些平面生成角坐标,并使用patch绘制它们(有关更多细节,请参见这个问题链接在来自bla的评论中)。下面是生成它们的一种方法(使它们具有一些alpha透明度):
xPlane = [-1 1 1 -1];      % X coordinates of plane corners, ordered around the plane
yPlane1 = xPlane+0.5;      % Corresponding y coordinates for plane 1
yPlane2 = xPlane;          % Corresponding y coordinates for plane 2
zPlane = [-10 -10 10 10];  % Z coordinates of plane corners
hold on;                   % Add to existing plot
patch(xPlane, yPlane1, zPlane, 'r', 'FaceAlpha', 0.5);  % Plot plane 1
patch(xPlane, yPlane2, zPlane, 'r', 'FaceAlpha', 0.5);  % Plot plane 2
由此产生的情节如下:
页面原文内容由Stack Overflow提供。腾讯云小微IT领域专用引擎提供翻译支持
原文链接:
https://stackoverflow.com/questions/49638505
复制相关文章
相似问题
腾讯云开发者

Copyright © 2013 - 2026 Tencent Cloud. All Rights Reserved. 腾讯云 版权所有
深圳市腾讯计算机系统有限公司 ICP备案/许可证号:粤B2-20090059 ![]() 粤公网安备44030502008569号
粤公网安备44030502008569号
腾讯云计算(北京)有限责任公司 京ICP证150476号 | 京ICP备11018762号