
Abaqus可视化密度
Abaqus可视化密度
提问于 2018-03-27 09:29:26
我试图优化某种材料的孔隙度分布。我想想象一下结果。我可以用‘可视化->材料’可视化不同的材料,但他给每一个材料一个随机的颜色。我希望最不致密的材料是蓝色的,最密集的是红色的。压力图也是如此。
在阿巴克斯有办法这样做吗?
如果在GUI中没有简单的方法可以做到这一点,我想知道是否可以使用脚本来实现呢?我试图更改一种颜色,这导致了以下代码:
session.viewports['Viewport: 1'].enableMultipleColors()
session.viewports['Viewport: 1'].setColor(initialColor='#BDBDBD')
cmap=session.viewports['Viewport: 1'].colorMappings['Material']
session.viewports['Viewport: 1'].setColor(colorMapping=cmap)
session.viewports['Viewport: 1'].disableMultipleColors()
session.viewports['Viewport: 1'].enableMultipleColors()
session.viewports['Viewport: 1'].setColor(initialColor='#BDBDBD')
cmap = session.viewports['Viewport: 1'].colorMappings['Material']
cmap.updateOverrides(overrides={'IMPLANT_MATERIAL0':(True, '#FF0000',
    'Default', '#FF0000')})
session.viewports['Viewport: 1'].setColor(colorMapping=cmap)
session.viewports['Viewport: 1'].disableMultipleColors()
session.viewports['Viewport: 1'].enableMultipleColors()
session.viewports['Viewport: 1'].setColor(initialColor='#BDBDBD')
cmap = session.viewports['Viewport: 1'].colorMappings['Material']
session.viewports['Viewport: 1'].setColor(colorMapping=cmap)
session.viewports['Viewport: 1'].disableMultipleColors()回答 2
Stack Overflow用户
回答已采纳
发布于 2018-03-28 11:30:31
如果你在寻找类似压力图可视化的东西,你必须写你自己的FieldOutput数据。通常,直接将数据输出到外部可视化程序比较容易,但在Abaqus中可以这样做(如果不是有点复杂的话)。
一般程序如下:
- 生成
FieldOutput对象;语法为FO = odbModel.steps.values()[-1].frames[-1].FieldOutput(name=data_name, description=data_description, type=SCALAR),其中
- `odbModel` is an opened `Odb` object,
- `steps.values()[-1]` or a named step `steps[...]` is the step you want to output to,
- `frames[-1]` is the last frame (or a frame of your choice) that you want to output to in this step,
- `data_name` and `data_description` are strings (for stress contour plots, `data_name` would be equivalent to the label `S` in the odb output)
- `SCALAR` is a parameter from the `abaqusConstants` module
- 获取
rootAssembly.instance对象,以及它们关联的元素elementSet和sectionAssignment,它们具有与具有density属性的material的section的明确链接。 - 使用
FieldOutput命令更新addData对象;语法为addData(position=CENTROID, instance=instance, labels=labels, data=data)CENTROID是来自abaqusConstants模块的一个参数(假设您只想在元素质心处有元素密度;如果您真的想要的话,您也可以将它们粘在积分点上)instance是与元素集相关联的实例(或者更一般地说,与此材料一起分配的region)。labels是一个可迭代的整数(list,tuple),它指定要写入数据的关联实例的元素标签。data是float的可迭代性,指定了数据。在您的例子中,单个密度值意味着data是一个可迭代的长度-1可迭代的值,每个迭代值都包含一个密度值。data的长度必须等于labels的长度,因为data的每个成员都精确地对应于在labels中相同位置的elementLabel。
下面的示例脚本(警告:强烈建议备份.odb,以防结果不对)
import odbAccess
from abaqusConstants import SCALAR, CENTROID # Import constants
odbModel = odbAccess.openOdb(odb_file_path) # Put the file path of the `odb` in odb_file_path
FO = odbModel.steps.values()[-1].frames[-1].FieldOutput(name='Density', description='', type=SCALAR)
# Loop through `rootAssembly.instances`
for instance in odbModel.rootAssembly.instances.values():
valid_materials = [] # Valid material names which have `density`
# Loop through `instance.sectionAssignments` to check if the associated `section` has a `material` with the attribute `density`
for i in range(len(instance.sectionAssignments)):
sectionName = instance.sectionAssignments[i].sectionName
matName = odbModel.sections[sectionName].material
if hasattr(odbModel.materials[matName], 'density'):
valid_materials.append(matName)
sectionNames = [] # Build list of valid section names which are associated with a material which has the attribute `density`
for s in odbModel.sections.values():
if s.material in valid_materials:
sectionNames.append(s.name)
if sectionNames:
# Loop through `sectionAssignments` and get all the `elementLabels` in the `region` of the `sectionAssignment`
for sa in instance.sectionAssignments:
sa_labels = []
if sa.sectionName in sectionNames:
# Get labels
if sa.region.elements is not None:
for e in sa.region.elements:
sa_labels.append(e.label)
# Get material
matName = odbModel.sections[sa.sectionName].material
sa_data = [(odbModel.materials[matName].density.table[0][0],)]*len(sa_labels)
# Update `fieldOutput` object
FO.addData(position=CENTROID, instance=instance, labels=sa_labels, data=sa_data)
# Save odb model. The FieldOutput object only exists as reference from `FO` unless the odb model is saved.
odbModel.save()
odbModel.close()
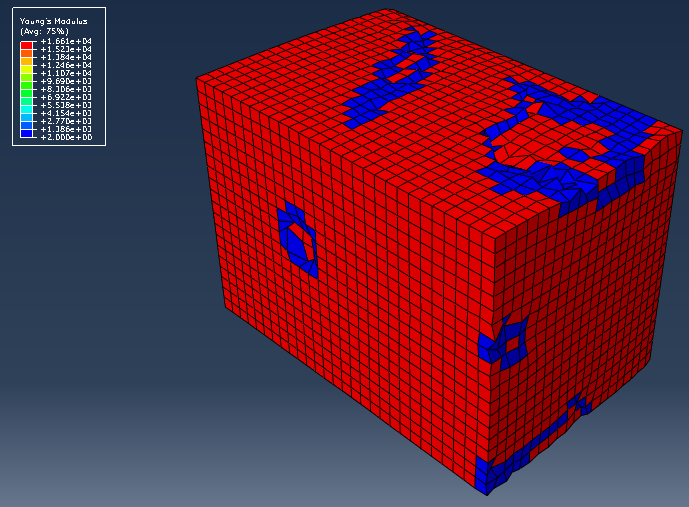
odbModel = odbAccess.openOdb(odb_file_path) # Reopen the model for visualisation. If you can't find the data_name in the list, expand the model to the step and frame for which the data is saved.我不考虑密度,但这是一个杨氏模量的例子,模型中有两种材料分配给不同的元素。
Stack Overflow用户
发布于 2018-03-28 10:31:56
这可能不是完美的方法,但这是可行的。限制:
-You需要手动输入大量的材料。
-Your材料应按密度排列(mat1,mat2->密度1)。
-You应该在脚本中加上你的材料名(在我的例子中,它是‘种植’)
改进的建议总是受欢迎的,这只是快速和肮脏。
from math import floor

diminishing_factor = 10 #This factor diminishes the amount of colors to:
amount of materials/diminishing factor. This is necessary
#because apparently abaqus can only handle a limited amount of colors (+-50)

def create_color_lst(amount_of_mat):

    color_lst=[]

    total_length = 256*4-1 #0 telt ook dus -1
    interval = floor(total_length/(amount_of_mat-1)) #*10 because we'll give
    10 consequent materials the same color, because abaqus can't handle it
    for i in range(0,amount_of_mat):
        pos = int(floor(i/diminishing_factor))*diminishing_factor*interval
        if pos<256: #Green is rising
            col_pos=pos
            code = (0,col_pos,255)
        elif pos<512: #Blue is diminishing
            col_pos=pos-255
            code = (0,255,255-col_pos)
        elif pos<768:
            col_pos = pos - 511
            code = (col_pos,255,0)
        elif pos<1024:
            col_pos = pos - 767
            code = (255,255-col_pos,0)
        else:
            raise ValueError('Color position is too high: '+str(pos))
        hex_code='#%02x%02x%02x' % code
        color_lst.append(hex_code.upper())
    return color_lst

def update_colors(color_lst):
    session.viewports['Viewport: 1'].enableMultipleColors()
    session.viewports['Viewport: 1'].setColor(initialColor='#BDBDBD')
    cmap = session.viewports['Viewport: 1'].colorMappings['Material']
    for i in range(0,amount_of_mat):
        material = 'IMPLANT_MATERIAL'+str(i)
        cmap.updateOverrides(overrides={material:(True, color_lst[i],
            'Default', color_lst[i])})
        if i%10==0:
            print(i)
    session.viewports['Viewport: 1'].setColor(colorMapping=cmap)
    session.viewports['Viewport: 1'].disableMultipleColors()


amount_of_mat=494 #We can't get this you should always check this! (you
probably could but I'm to lazy to search it)


color_lst = create_color_lst(amount_of_mat) #Creates a list with strings
that contain the color names

update_colors(color_lst) #Updates the display (it's possible that you still
need to go to the display color dialog and press apply)页面原文内容由Stack Overflow提供。腾讯云小微IT领域专用引擎提供翻译支持
原文链接:
https://stackoverflow.com/questions/49509158
复制相关文章
相似问题
腾讯云开发者

Copyright © 2013 - 2026 Tencent Cloud. All Rights Reserved. 腾讯云 版权所有
深圳市腾讯计算机系统有限公司 ICP备案/许可证号:粤B2-20090059 ![]() 粤公网安备44030502008569号
粤公网安备44030502008569号
腾讯云计算(北京)有限责任公司 京ICP证150476号 | 京ICP备11018762号