
如何自动识别图像中的多行?
如何自动识别图像中的多行?
提问于 2018-03-26 13:22:12
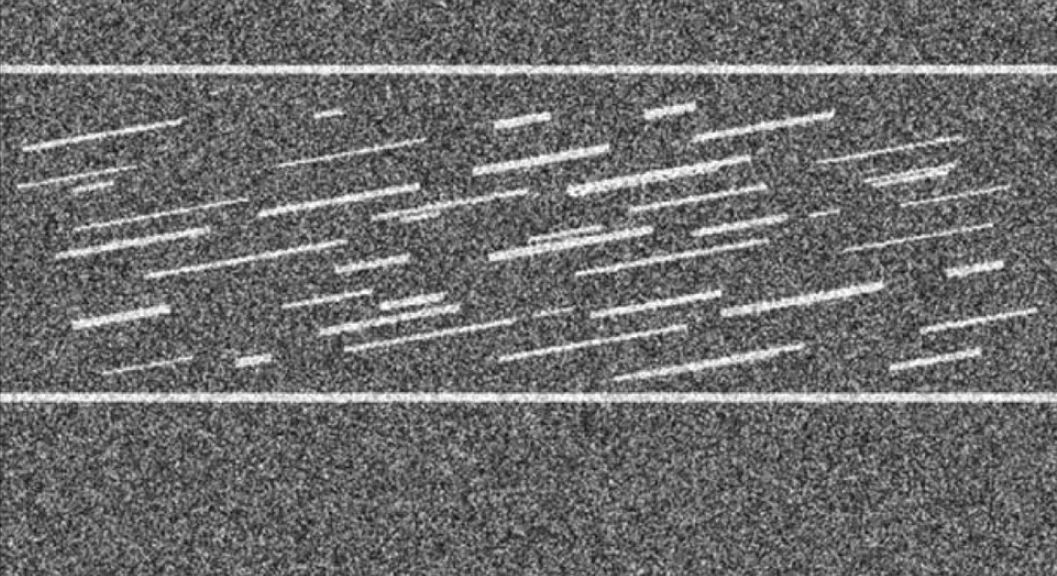
给出一个包含角度线的二值图像,我怎么能自动识别出尽可能多的线呢?使用Matlab中的bwtraceboundary函数,我能够识别其中的一个,手动提供识别线的起始坐标。
有谁能指出一种方法来循环0和1的矩阵来自动识别尽可能多的数字呢?
下面是一个示例图像:
% Read the image
I = imread('./synthetic.jpg');


figure(1)
BW = im2bw(I, 0.7);
imshow(BW2,[]);
c = 255; % X coordinate of a manually identified line
r = 490; % Y coordinate of a manually identified line
contour = bwtraceboundary(BW,[c r],'NE',8, 1000,'clockwise');
imshow(BW,[]);
hold on;
plot(contour(:,2),contour(:,1),'g','LineWidth',2);
从上面的代码中我们可以得到:

回答 1
Stack Overflow用户
回答已采纳
发布于 2018-03-26 13:41:21
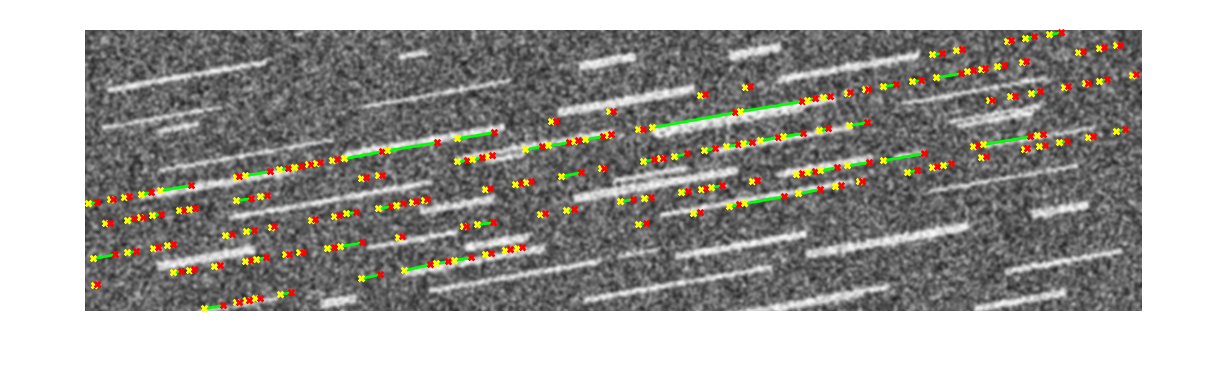
这是一个很小的例子,说明如何在MATLAB中使用Hough变换,并先对图像进行去噪。
这段代码并不能检测到所有的行,您可能需要对它进行一些调优/修改,这需要了解一下发生了什么,这超出了StackOverflow的范围。也许有更多知识的人能找到更好的方法:
I=rgb2gray(imread('https://i.stack.imgur.com/fTWHh.jpg'));

I = imgaussfilt(I,1);
I=I([90:370],:);
BW = edge(I,'canny');
[H,T,R] = hough(BW);
P  = houghpeaks(H,5,'threshold',ceil(0.3*max(H(:))));
lines = houghlines(BW,T,R,P,'FillGap',5,'MinLength',3);

figure, imshow(I), hold on
max_len = 0;
for k = 1:length(lines)
   xy = [lines(k).point1; lines(k).point2];
   plot(xy(:,1),xy(:,2),'LineWidth',2,'Color','green');

   % Plot beginnings and ends of lines
   plot(xy(1,1),xy(1,2),'x','LineWidth',2,'Color','yellow');
   plot(xy(2,1),xy(2,2),'x','LineWidth',2,'Color','red');

   % Determine the endpoints of the longest line segment
   len = norm(lines(k).point1 - lines(k).point2);
   if ( len > max_len)
      max_len = len;
      xy_long = xy;
   end
end
页面原文内容由Stack Overflow提供。腾讯云小微IT领域专用引擎提供翻译支持
原文链接:
https://stackoverflow.com/questions/49492530
复制相关文章
相似问题
腾讯云开发者

Copyright © 2013 - 2026 Tencent Cloud. All Rights Reserved. 腾讯云 版权所有
深圳市腾讯计算机系统有限公司 ICP备案/许可证号:粤B2-20090059 ![]() 粤公网安备44030502008569号
粤公网安备44030502008569号
腾讯云计算(北京)有限责任公司 京ICP证150476号 | 京ICP备11018762号