
使用scipy.interpolate.griddata时意外的结果
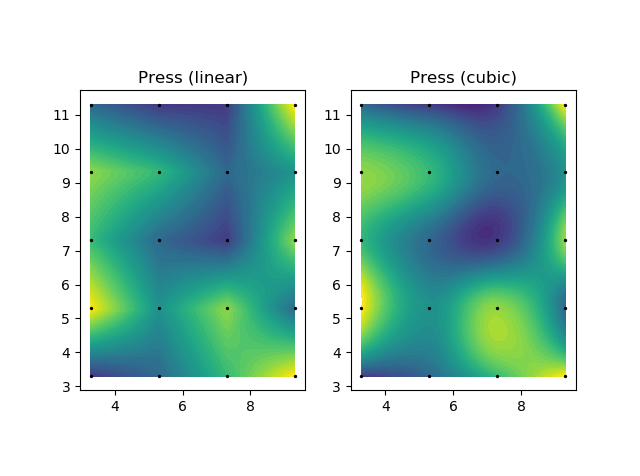
当我需要用Python内插数据时,我通常使用C中数值食谱中的双线性和双三次例程的实现(W.H. Press,1992)。主要的原因是我没有得到我所期望的。由于我现在需要更多的灵活性(例如不规则网格),所以我想使用griddata函数。
下面的脚本可以说明我的问题:
from matplotlib import pyplot as plt
from scipy.interpolate import griddata

from interp import *    # My own interpolation functions (from Press. 1992)

# Create test data
nPts = 50
color_ticks = np.linspace(0., 6., 50, endpoint = True)

pts1 = np.array([[0, 0], [0, 1], [0, 2], [0, 3], [0, 4],
                 [1, 0], [1, 1], [1, 2], [1, 3], [1, 4],
                 [2, 0], [2, 1], [2, 2], [2, 3], [2, 4],
                 [3, 0], [3, 1], [3, 2], [3, 3], [3, 4]])*2 + 3.3

z1 = np.array([[1], [6], [4], [5], [2],
               [2], [3], [2], [4], [1],
               [4], [5], [1], [2], [1],
               [6], [2], [5], [3], [6]], dtype = np.float64)

# Interpolation coordinates
xi, yi = np.linspace(0,3,nPts)*2 + 3.3, np.linspace(0,4,nPts)*2 + 3.3

# Scipy, bilinear
scipy_linear = griddata((pts1[:,0], pts1[:,1]), z1, (xi[None,:], yi[:,None]), method = 'linear')

# Scipy, bicubic
scipy_cubic = griddata((pts1[:,0], pts1[:,1]), z1, (xi[None,:], yi[:,None]), method = 'cubic')

# Press, bilinear
pts2 = np.zeros((nPts*nPts,2))

for i in range(0, nPts):
    for j in range(0, nPts):
        pts2[i*nPts + j,:] = [xi[i], yi[j]]

press_linear = interp_linear(np.unique(pts1[:,0]), np.unique(pts1[:,1]),
    z1.reshape(4,5), pts2[:,0], pts2[:,1])

# Press, bicubic
press_cubic = interp_cubic(np.unique(pts1[:,0]), np.unique(pts1[:,1]),
    z1.reshape(4,5), pts2[:,0], pts2[:,1])

# Display
fig_scipy = plt.figure()
fig_press = plt.figure()

ax1 = fig_scipy.add_subplot(121, aspect = 'equal')
ax1.set_title("Scipy (linear)")
ax1.contourf(xi, yi, scipy_linear.reshape(nPts, nPts), color_ticks)
ax1.scatter(pts1[:,0], pts1[:,1], color = 'k', s = 2)

ax2 = fig_scipy.add_subplot(122, aspect = 'equal')
ax2.set_title("Scipy (cubic)")
ax2.contourf(xi, yi, scipy_cubic.reshape(nPts, nPts), color_ticks)
ax2.scatter(pts1[:,0], pts1[:,1], color = 'k', s = 2)

ax3 = fig_press.add_subplot(121, aspect = 'equal')
ax3.set_title("Press (linear)")
ax3.contourf(xi, yi, press_linear.reshape(nPts, nPts).T, color_ticks)
ax3.scatter(pts1[:,0], pts1[:,1], color = 'k', s = 2)

ax4 = fig_press.add_subplot(122, aspect = 'equal')
ax4.set_title("Press (cubic)")
ax4.contourf(xi, yi, press_cubic.reshape(nPts, nPts).T, color_ticks)
ax4.scatter(pts1[:,0], pts1[:,1], color = 'k', s = 2)

plt.show()
我自己函数的插值给出了我认为是正确的:
虽然来自griddata的插值结果(注意差异,特别是在等高线的右下角):
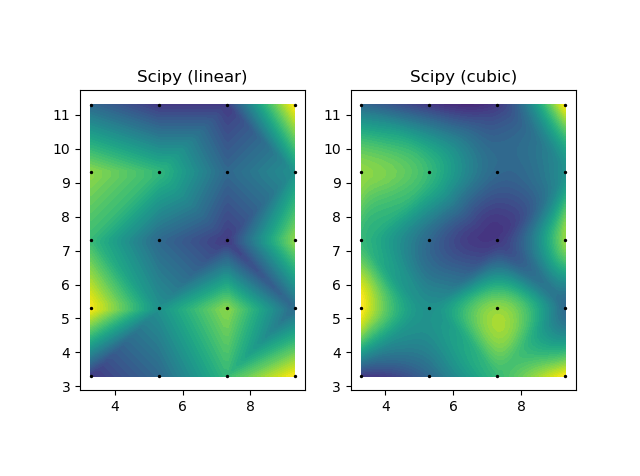
我正确地使用了griddata吗?如果是的话,差异是从哪里来的呢?一个结果比另一个好吗?我能看到的一个解释是,我计算双三次函数中的导数的方式,但这并不能解释两种双线性方法之间的差异。
回答 1
Stack Overflow用户
发布于 2018-03-09 08:49:27
在两种双线性方法之间。
你的方法可能是双线性的,但SciPy的不是。从图像中的分段线性梯度可以看出这一点,文档确认:
将输入点集转化为n维单纯形,并对每个单形进行线性插值.
所以,SciPy的插值是局部a*x + b*y + c,而您的是a*x*y + b*x + c*y + d
利用SciPy实现非结构化数据的双线性插值,采用SmoothBivariateSpline与kx=1和ky=1 (双线性),s=0 (无平滑)。(但要实现s=0,似乎需要比本例中更多的数据点。)
对于矩形网格上的双线性插值,有RectBivariateSpline,也有kx=1和ky=1。
至于立方版本的不同,有程序中太多的细节可以期望您的插值将完全符合SciPy的。
https://stackoverflow.com/questions/49185127
复制相似问题
腾讯云开发者

Copyright © 2013 - 2026 Tencent Cloud. All Rights Reserved. 腾讯云 版权所有
深圳市腾讯计算机系统有限公司 ICP备案/许可证号:粤B2-20090059  粤公网安备44030502008569号
腾讯云计算(北京)有限责任公司 京ICP证150476号 | 京ICP备11018762号