
在Plots.jl中增加子图之间的空间
在Plots.jl中增加子图之间的空间
提问于 2018-03-08 08:43:52
如何在Plots.jl中增加子图之间的空间?
最小非工作示例:
julia> using Plots; pyplot()
Plots.PyPlotBackend()

julia> data = [rand(100), rand(100)];
       histogram(data, layout=2, title=["Dataset A" "Dataset B"], legend=false)
       ylabel!("ylabel")
如果使图形足够小,则第二个图的y标签与第一个图发生冲突。
回答 2
Stack Overflow用户
回答已采纳
发布于 2018-03-08 09:32:45
在属性文档的Plots.jl部分中,有一个称为子图的部分。在那里,您会发现关键字margin、top_margin、bottom_margin、left_margin和right_margin可能对您有帮助。
那么,最低限度的工作示例是:
using Plots, Measures
pyplot()

data = [rand(100), rand(100)];

histogram(data, layout = 2,
          title = ["Dataset A" "Dataset B"], legend = false,
ylabel = "ylabel", margin = 5mm)顺便说一句,注意using Measures部分。我希望这能帮到你。
Stack Overflow用户
发布于 2022-11-24 20:46:58
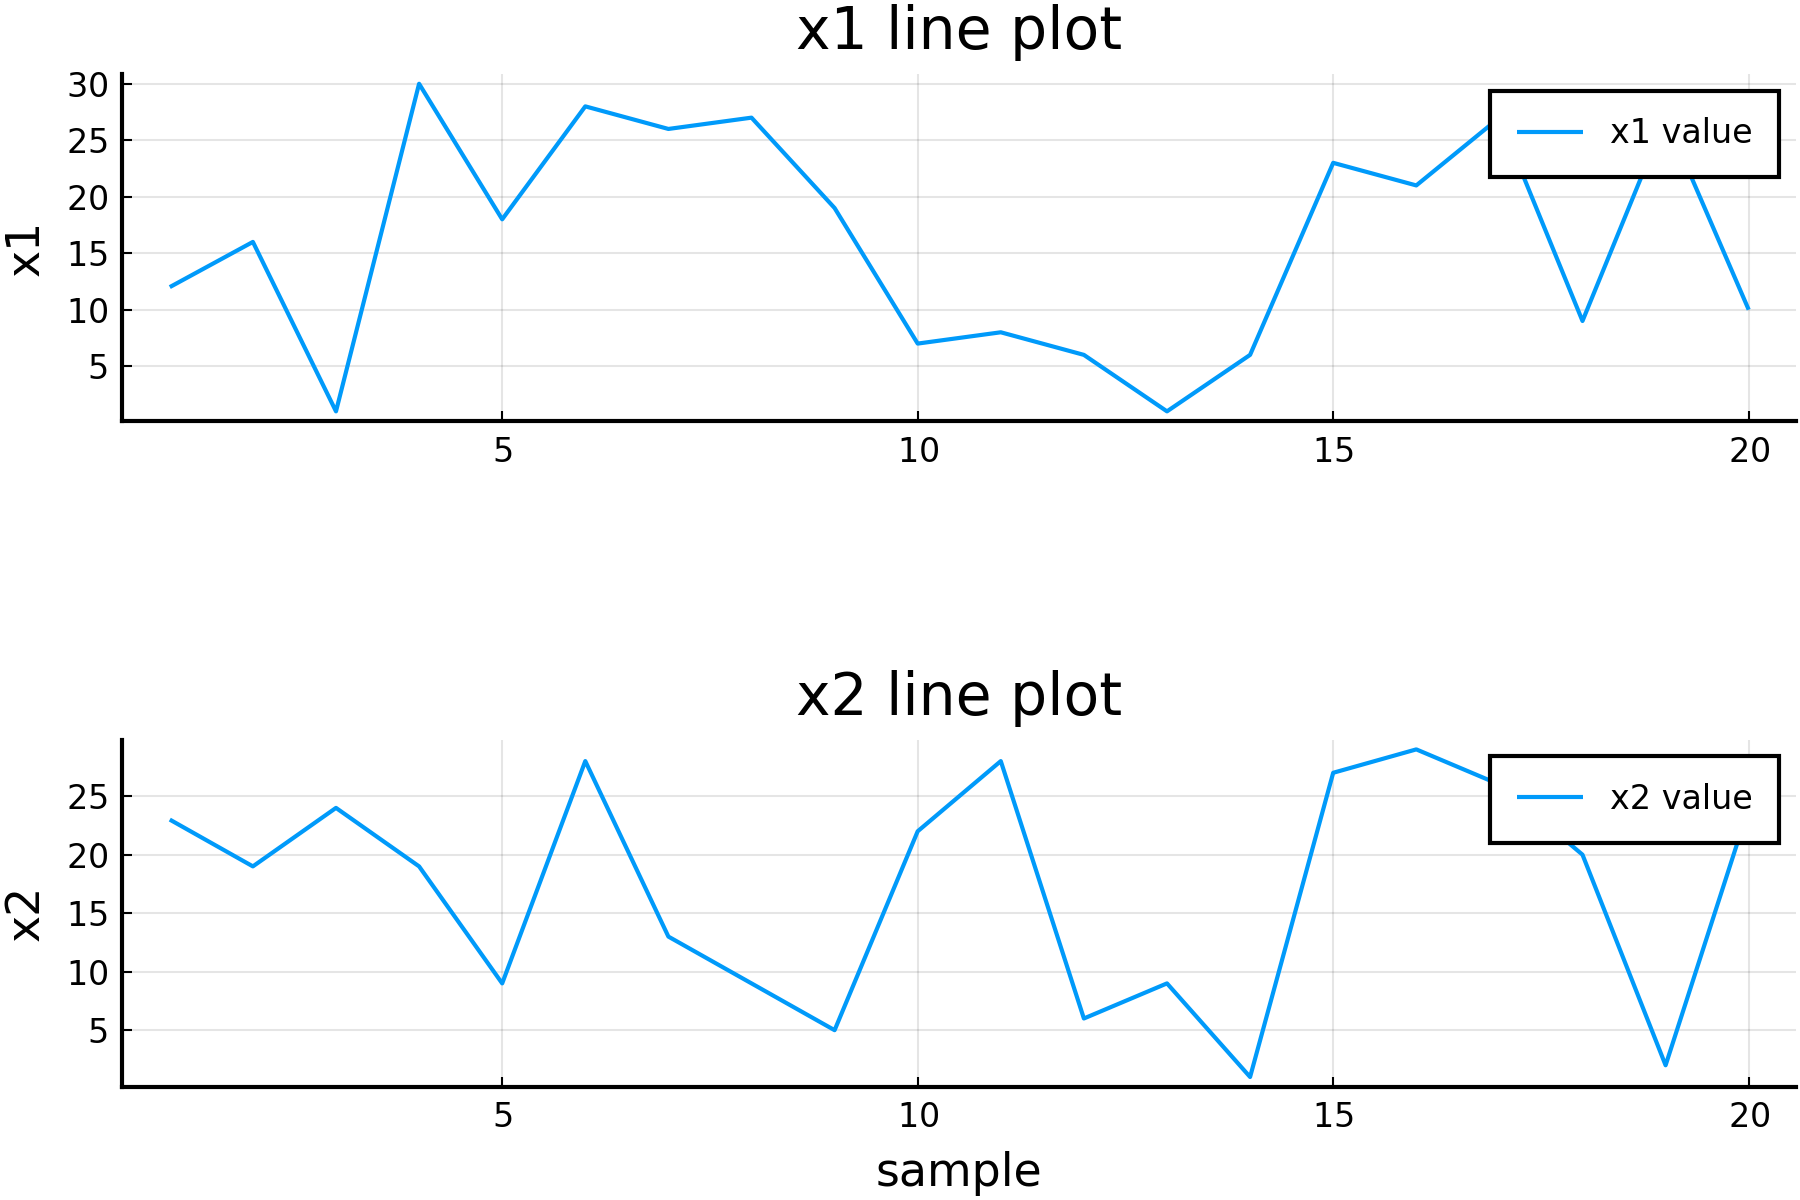
另一个解决方法是使用bottom_margin关键字参数来保存pyplot后端,如下所示:
using Plots
pyplot()

x1 = rand(1:30, 20);
x2 = rand(1:30, 20);

# subplot 1
p1 = plot(
    x1,
    label="x1 value",
    title="x1 line plot",
    ylabel="x1",
    bottom_margin=50*Plots.mm,
);

# subplot 2
p2 = plot(
    x2,
    label="x2 value",
    title="x2 line plot",
    xlabel="sample",
    ylabel="x2",
);

plot(
    p1,
    p2,
    layout=grid(
        2,1,
    )
)
页面原文内容由Stack Overflow提供。腾讯云小微IT领域专用引擎提供翻译支持
原文链接:
https://stackoverflow.com/questions/49168872
复制相关文章
相似问题
腾讯云开发者

Copyright © 2013 - 2026 Tencent Cloud. All Rights Reserved. 腾讯云 版权所有
深圳市腾讯计算机系统有限公司 ICP备案/许可证号:粤B2-20090059 ![]() 粤公网安备44030502008569号
粤公网安备44030502008569号
腾讯云计算(北京)有限责任公司 京ICP证150476号 | 京ICP备11018762号