
用Python可视化球面谐波
用Python可视化球面谐波
提问于 2018-03-07 18:02:18
我正试图为我的大学项目画一个球形谐波。下面是我要描述的公式,
Y = cos(theta)为此,我编写了以下代码
import numpy as np
from mpl_toolkits.mplot3d import axes3d
import matplotlib.pyplot as plt

def sph2cart(r, phi, tta):
   ''' r is from 0 to infinity '''
   ''' phi is from 0 to 2*pi '''
   ''' tta is from 0 to pi '''
   x = r* np.sin(tta)* np.cos(phi)
   y = r* np.sin(tta)* np.sin(phi)
   z = r* np.cos(tta)
   return x, y, z

# phi running from 0 to pi and tta from 0 to pi
phi = np.linspace(0, 2* np.pi, 25)
tta = np.linspace(0, np.pi, 25)
# meshgrid to generate points
phi, tta = np.meshgrid(phi, tta)

# THIS IS THE FUNCTION
Y = np.cos(tta)
# finally all things in cartesian co-ordinate system
# Note that "Y" is acting as "r"
x, y, z = sph2cart( Y, phi, tta)

# plotting :-
fig = plt.figure()
ax = fig.add_subplot( 111 , projection='3d')
ax.plot_surface(x, y, z, linewidth = 0.5, edgecolors = 'k')
然后,得到球体作为结果。这是不正确的,因为实际结果是哑铃状。请参阅此图像的第二行,
回答 2
Stack Overflow用户
回答已采纳
发布于 2018-03-07 21:05:23
维基百科文章球面谐波中的图片是用球面调和的绝对值作为r坐标,然后根据谐波的符号着色曲面。这是一个近似。
x, y, z = sph2cart(np.abs(Y), phi, tta)

fig = plt.figure()
ax = fig.add_subplot( 111 , projection='3d')

from matplotlib import cm
ax.set_aspect('equal')
ax.plot_surface(x, y, z, linewidth = 0.5, facecolors = cm.jet(Y), edgecolors = 'k')
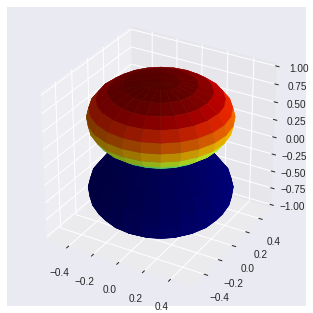
当你用Y本身作为r时,两个半球(正Y和负Y)最终映射到上面表面的同一半部。
Stack Overflow用户
发布于 2018-03-07 21:12:55
传递给函数的Y必须是一个绝对值,才能使它变成r,否则z=cos(θ)^2总是正数。如果r是半径,那么这就是你应该做的。
x, y, z = sph2cart(np.abs(Y), phi, tta)页面原文内容由Stack Overflow提供。腾讯云小微IT领域专用引擎提供翻译支持
原文链接:
https://stackoverflow.com/questions/49158505
复制相关文章
相似问题
腾讯云开发者

Copyright © 2013 - 2026 Tencent Cloud. All Rights Reserved. 腾讯云 版权所有
深圳市腾讯计算机系统有限公司 ICP备案/许可证号:粤B2-20090059 ![]() 粤公网安备44030502008569号
粤公网安备44030502008569号
腾讯云计算(北京)有限责任公司 京ICP证150476号 | 京ICP备11018762号