
如何在R中使用Dataframe创建所需矩阵
如何在R中使用Dataframe创建所需矩阵
提问于 2018-03-04 17:39:24
我有一张数据文件,看起来像:
DF_1>
T_id  D1             D2                   Num     type    type_2     fig
xt-1  2017-05-01     2017-03-25 12:11:45  10      A       X          25.20
xt-2  2017-05-01     2017-03-25 21:05:25  20      A       Y          20.15
xt-3  2017-05-01     2017-03-25 08:10:55  25      B       X          15.11
xt-4  2017-05-03     2017-03-25 07:19:35  30      B       Y          22.56
xt-5  2017-05-03     2017-03-25 13:12:56  45      C       Z          35.45
xt-6  2017-05-03     2017-03-25 18:14:44  20      D       Z          27.21
xt-7  2017-04-06     2017-03-25 19:21:35  15      A       Z          23.20
xt-8  2017-04-06     2017-03-25 21:11:15  40      C       X          21.40
xt-9  2017-04-08     2017-02-25 22:25:04  20      A       A          27.50
xt-10 2017-04-06     2017-02-25 16:04:08  30      A       Y          32.20
xt-11 2017-04-05     2017-02-25 18:15:25  20      C       Z          30.20
xt-12 2017-04-01     2017-01-25 19:22:25  50      A       Z          33.15
xt-13 2017-04-02     2017-01-25 23:19:05  15      A       A          30.12
xt-14 2017-03-03     2017-01-25 14:25:09  15      D       Y          31.25
xt-15 2017-03-10     2017-01-25 23:25:36  40      A       X          25.45
根据上面的数据,我想在下面提到两个矩阵:
1. Date (Last Three Date from `sys.date()`)

    D1    count  sum  mean_num total_sum count_A sum_A count_other sum_other mean_fig   mean_TAT

    2017-05-03 3 95  31.66     6         0       0     3           95        28.40
    2017-05-02 0 0   0         3         0       0     0           0         0.00
2017-05-01 3 55 18.33 3 2 30 1 25 20.15- 用于计算
mean_TAT:减法D2-D1,并根据同一日期的count值计算当天的平均值。 total_sum将从这个月的第一个日期开始累积。count_A和sum_A基于type作为特定日子的A。count_other和sum_other适用于type不是A的地方。
2.基于月份(最后三个月,根据数据)
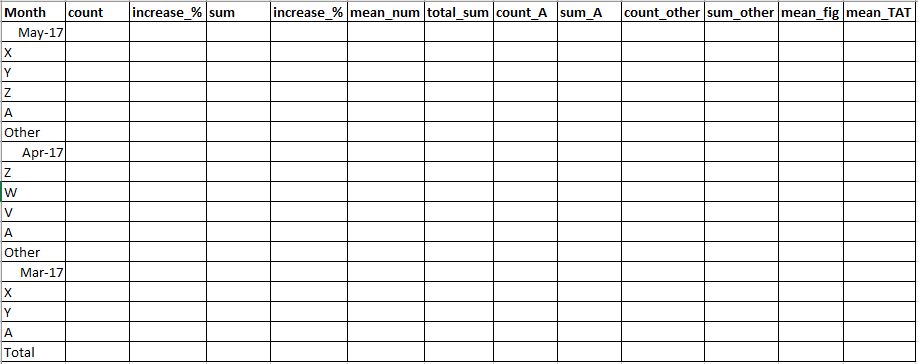
因为基于月份的格式是相同的,只有按月计算。
- 每个月有5行2列,其中前3行是根据特定月份的计数计算的前3行
type_2。 increase_%将在前一个月计算(即,如果5月17日的count比4月17日的count为50,则为-50% ),而其他5行则以其上一个月的count和sum为基础。- 第四,对于
A为"A“的值,每个月的值都是常数。 - 第五,
Other将不同于上面提到的4type_2。 Total将与count和sum的列相同,将有加法,而对于mean,则为mean。
似乎我无法正确地解释,希望矩阵是可以理解的数据。
期待着得到一些帮助。
回答 1
Stack Overflow用户
回答已采纳
发布于 2018-03-07 09:08:27
这里已经是第一部分了:
library(lubridate)
library(dplyr)

df2 <- df1 %>%
  mutate(ym = year(D1)*100+month(D1)) %>%
  arrange(D1) %>%
  group_by(D1,ym) %>%
  summarize(count = n(),
            sum=sum(Num),
            mean_num=mean(Num),
            count_A=sum(type=='A'),
            sum_A=sum(Num * (type=='A')),
            count_other=sum(type!='A'),
            sum_other=sum(Num * (type!='A')),
            mean_fig = mean(fig),
            mean_TAT = mean(D2-D1)) %>%
  group_by(ym) %>%
  mutate(total_sum=cumsum(count)) %>%
  ungroup %>%
  arrange(desc(D1)) %>%
  select(D1,count,sum,mean_num,total_sum,count_A,sum_A,count_other,sum_other,mean_fig,mean_TAT)


# # A tibble: 9 x 11
# D1 count   sum mean_num total_sum count_A sum_A count_other sum_other mean_fig       mean_TAT
# <date> <int> <int>    <dbl>     <int>   <int> <int>       <int>     <int>    <dbl>         <time>
# 1 2017-05-03     3    95 31.66667         6       0     0           3        95 28.40667 -39.00000 days
# 2 2017-05-01     3    55 18.33333         3       2    30           1        25 20.15333 -37.00000 days
# 3 2017-04-08     1    20 20.00000         7       1    20           0         0 27.50000 -42.00000 days
# 4 2017-04-06     3    85 28.33333         6       2    45           1        40 25.60000 -21.33333 days
# 5 2017-04-05     1    20 20.00000         3       0     0           1        20 30.20000 -39.00000 days
# 6 2017-04-02     1    15 15.00000         2       1    15           0         0 30.12000 -67.00000 days
# 7 2017-04-01     1    50 50.00000         1       1    50           0         0 33.15000 -66.00000 days
# 8 2017-03-10     1    40 40.00000         2       1    40           0         0 25.45000 -44.00000 days
# 9 2017-03-03     1    15 15.00000         1       0     0           1        15 31.25000 -37.00000 days
数据
df1 <- read.table(text="T_id  D1             D2                   Num     type    type_2     fig
                  xt-1  2017-05-01     '2017-03-25 12:11:45'  10      A       X          25.20
                  xt-2  2017-05-01     '2017-03-25 21:05:25'  20      A       Y          20.15
                  xt-3  2017-05-01     '2017-03-25 08:10:55'  25      B       X          15.11
                  xt-4  2017-05-03     '2017-03-25 07:19:35'  30      B       Y          22.56
                  xt-5  2017-05-03     '2017-03-25 13:12:56'  45      C       Z          35.45
                  xt-6  2017-05-03     '2017-03-25 18:14:44'  20      D       Z          27.21
                  xt-7  2017-04-06     '2017-03-25 19:21:35'  15      A       Z          23.20
                  xt-8  2017-04-06     '2017-03-25 21:11:15'  40      C       W          21.40
                  xt-9  2017-04-08     '2017-02-25 22:25:04'  20      A       Q          27.50
                  xt-10 2017-04-06     '2017-02-25 16:04:08'  30      A       W          32.20
                  xt-11 2017-04-05     '2017-02-25 18:15:25'  20      C       V          30.20
                  xt-12 2017-04-01     '2017-01-25 19:22:25'  50      A       Z          33.15
                  xt-13 2017-04-02     '2017-01-25 23:19:05'  15      A       Z          30.12
                  xt-14 2017-03-03     '2017-01-25 14:25:09'  15      D       Y          31.25
                  xt-15 2017-03-10     '2017-01-25 23:25:36'  40      A       X          25.45",h=T,strin=F)

df1$D1 <- as.Date(df1$D1,"%Y-%m-%d")
df1$D2 <- as.Date(df1$D2,"%Y-%m-%d")

expected_output <- read.table(text="D1    count  sum  mean_num total_sum count_A sum_A count_other sum_other mean_fig
                     2017-05-03 3 95  31.66     6         0       0     3           95        28.40
                     2017-05-02 0 0   0         3         0       0     0           0         0.00
2017-05-01 3 55 18.33 3 2 30 1 25 20.15")第2部分:的一些提示
没有你的问题,我不可能创造奇迹(给出一个精确的、可复制的输出在这里是非常必要的)。但这里有个接近的方法,希望:
df_month <- df1 %>%
  mutate(ym = year(D1)*100+month(D1)) %>%
  arrange(D1) %>%
  group_by(ym) %>%
  summarize(count = n(),
            sum=sum(Num),
            mean_num=mean(Num),
            count_A=sum(type=='A'),
            sum_A=sum(Num * (type=='A')),
            count_other=sum(type!='A'),
            sum_other=sum(Num * (type!='A')),
            mean_fig = mean(fig),
            mean_TAT = mean(D2-D1)) %>%
  mutate(type_2=paste0(month.abb[ym%% 100],"-",ym %/% 100 -2000)) %>%
  select(ym,type_2,count,sum,mean_num,count_A,sum_A,count_other,sum_other,mean_fig,mean_TAT)


df_top3 <- df1 %>%
  filter(type_2 !="A") %>%
  mutate(ym = year(D1)*100+month(D1)) %>%
  arrange(desc(ym)) %>%
  group_by(ym,type_2) %>%
  summarize(count = n(),
            sum=sum(Num),
            mean_num=mean(Num),
            count_A=sum(type=='A'),
            sum_A=sum(Num * (type=='A')),
            count_other=sum(type!='A'),
            sum_other=sum(Num * (type!='A')),
            mean_fig = mean(fig),
            mean_TAT = mean(D2-D1)) %>%
  group_by(ym) %>%
  arrange(desc(count)) %>%
  slice(1:3) %>%
  ungroup %>%
  select(ym,type_2,count,sum,mean_num,count_A,sum_A,count_other,sum_other,mean_fig,mean_TAT)


df_A <- df1 %>%
  filter(type_2 == "A") %>%
  mutate(ym = year(D1)*100+month(D1)) %>%
  arrange(desc(ym)) %>%
  group_by(ym,type_2) %>%
  summarize(count = n(),
            sum=sum(Num),
            mean_num=mean(Num),
            count_A=sum(type=='A'),
            sum_A=sum(Num * (type=='A')),
            count_other=sum(type!='A'),
            sum_other=sum(Num * (type!='A')),
            mean_fig = mean(fig),
            mean_TAT = mean(D2-D1)) %>%
  select(ym,type_2,count,sum,mean_num,count_A,sum_A,count_other,sum_other,mean_fig,mean_TAT)


df_other <- df1 %>%
  mutate(ym = year(D1)*100+month(D1)) %>%
  anti_join(bind_rows(df_top3,df_A),by = c("ym","type_2")) %>%
  mutate(type_2="Other") %>%
  arrange(desc(ym)) %>%
  group_by(ym,type_2) %>%
  summarize(count = n(),
            sum=sum(Num),
            mean_num=mean(Num),
            count_A=sum(type=='A'),
            sum_A=sum(Num * (type=='A')),
            count_other=sum(type!='A'),
            sum_other=sum(Num * (type!='A')),
            mean_fig = mean(fig),
            mean_TAT = mean(D2-D1)) %>%
  select(ym,type_2,count,sum,mean_num,count_A,sum_A,count_other,sum_other,mean_fig,mean_TAT)
# it's empty with your example data


bind_rows(df_month,df_top3,df_A,df_other) %>%
  arrange(ym) %>%
  select(-ym) %>%
rename(Month = type_2)页面原文内容由Stack Overflow提供。腾讯云小微IT领域专用引擎提供翻译支持
原文链接:
https://stackoverflow.com/questions/49098331
复制相关文章
相似问题
腾讯云开发者

Copyright © 2013 - 2026 Tencent Cloud. All Rights Reserved. 腾讯云 版权所有
深圳市腾讯计算机系统有限公司 ICP备案/许可证号:粤B2-20090059 ![]() 粤公网安备44030502008569号
粤公网安备44030502008569号
腾讯云计算(北京)有限责任公司 京ICP证150476号 | 京ICP备11018762号