
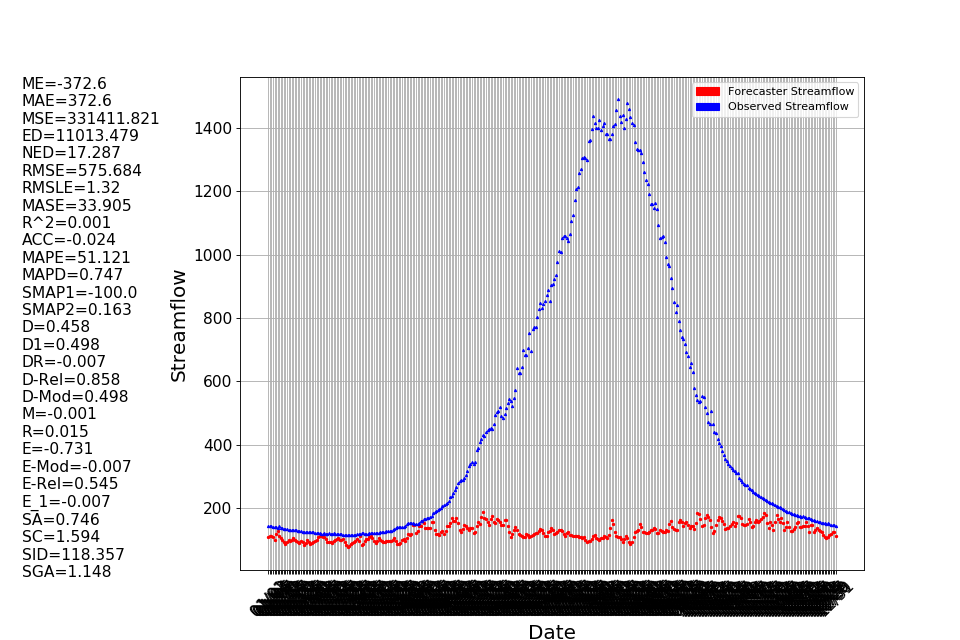
如何强制在matplotlib上设置x标记,或将日期时间类型设置为无年份
如何强制在matplotlib上设置x标记,或将日期时间类型设置为无年份
提问于 2018-01-20 04:07:17
回答 2
Stack Overflow用户
回答已采纳
发布于 2018-01-20 09:50:35
您可以通过ax.set_xticks()设置x轴使用的刻度,通过ax.set_xticklabels()设置标签。
例如,您可以只为该方法提供要使用的日期列表,例如当前pd.DataFrame索引(df.index[::20])的每20个值,然后将日期字符串的格式设置如下。
# Get the current axis
ax = plt.gca()

# Only label every 20th value
ticks_to_use = df.index[::20]

# Set format of labels (note year not excluded as requested)
labels = [ i.strftime("%-H:%M") for i in ticks_to_use ]

# Now set the ticks and labels
ax.set_xticks(ticks_to_use)
ax.set_xticklabels(labels)
Notes
如果标签仍然重叠,还可以通过传递旋转参数(例如ax.set_xticklabels(labels, rotation=45))来旋转它们。
这里有一个关于时间字符串格式的有用参考:http://strftime.org。
Stack Overflow用户
发布于 2019-10-25 14:52:56
我的情节也面临着类似的问题。

Matplotlib在轴上自动处理时间戳,但只有在时间戳格式时才自动处理。index中的时间戳是字符串格式的,因此我将read_csv更改为
pd.read_csv(file_path, index_col=[0], parse_dates=True)尝试将索引更改为时间戳格式。这为我解决了问题,希望对你也一样。
页面原文内容由Stack Overflow提供。腾讯云小微IT领域专用引擎提供翻译支持
原文链接:
https://stackoverflow.com/questions/48352482
复制相关文章
相似问题
腾讯云开发者

Copyright © 2013 - 2026 Tencent Cloud. All Rights Reserved. 腾讯云 版权所有
深圳市腾讯计算机系统有限公司 ICP备案/许可证号:粤B2-20090059 ![]() 粤公网安备44030502008569号
粤公网安备44030502008569号
腾讯云计算(北京)有限责任公司 京ICP证150476号 | 京ICP备11018762号