
居中对齐ggplot2中的图例标题和图例键以获取长图例标题。
我有一个困难的时间,使一个传奇中心的标题相对于传奇键,当传奇标题是长的。有一个问题来自一年前,它适用于短标题,但似乎不适用于长标题。
例如,首先有一个简短的图例标题:
library(ggplot2)
ggplot(iris, aes(x=Sepal.Length, y=Sepal.Width, color=Petal.Width)) + geom_point(size = 3) +
  scale_color_distiller(palette = "YlGn", type = "seq", direction = -1,
                        name = "A") +
  theme(legend.title.align = 0.5)
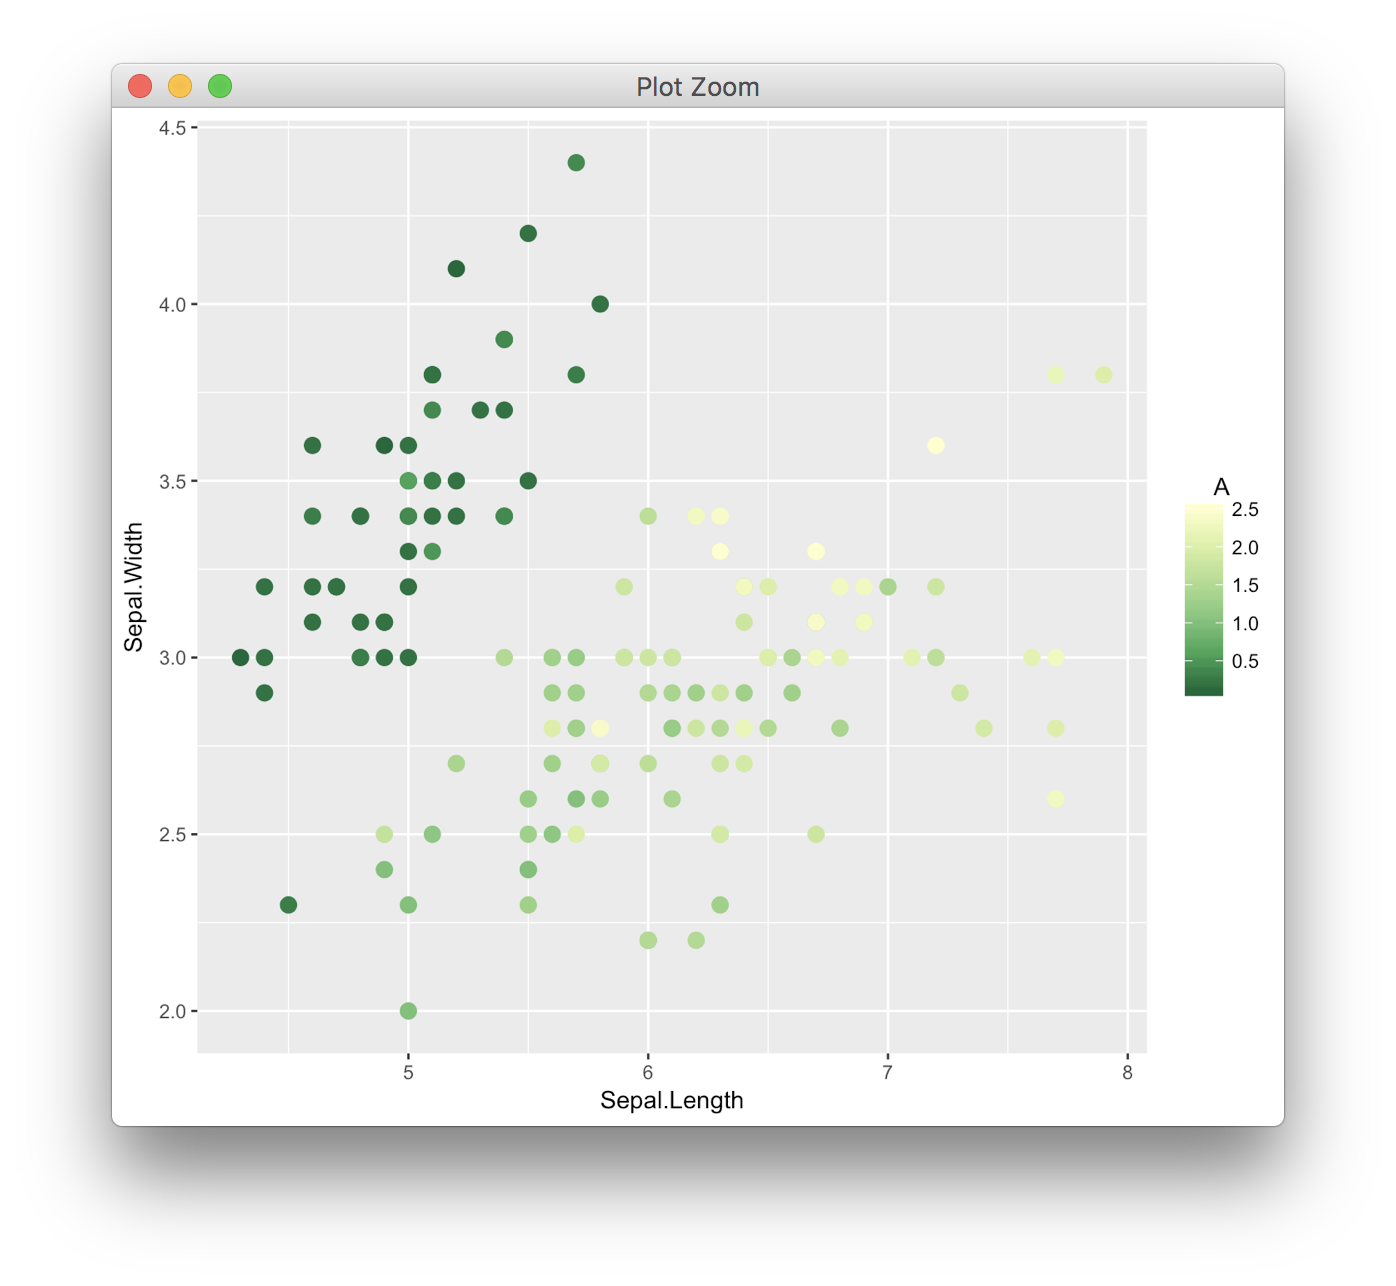
一切如出一辙,图例标题在图例键上方居中。
同样的,还有一个很长的传奇标题:
ggplot(iris, aes(x=Sepal.Length, y=Sepal.Width, color=Petal.Width)) + geom_point(size = 3) +
  scale_color_distiller(palette = "YlGn", type = "seq", direction = -1,
                        name = "Long legend heading\nShould be centered") +
  theme(legend.title.align = 0.5)
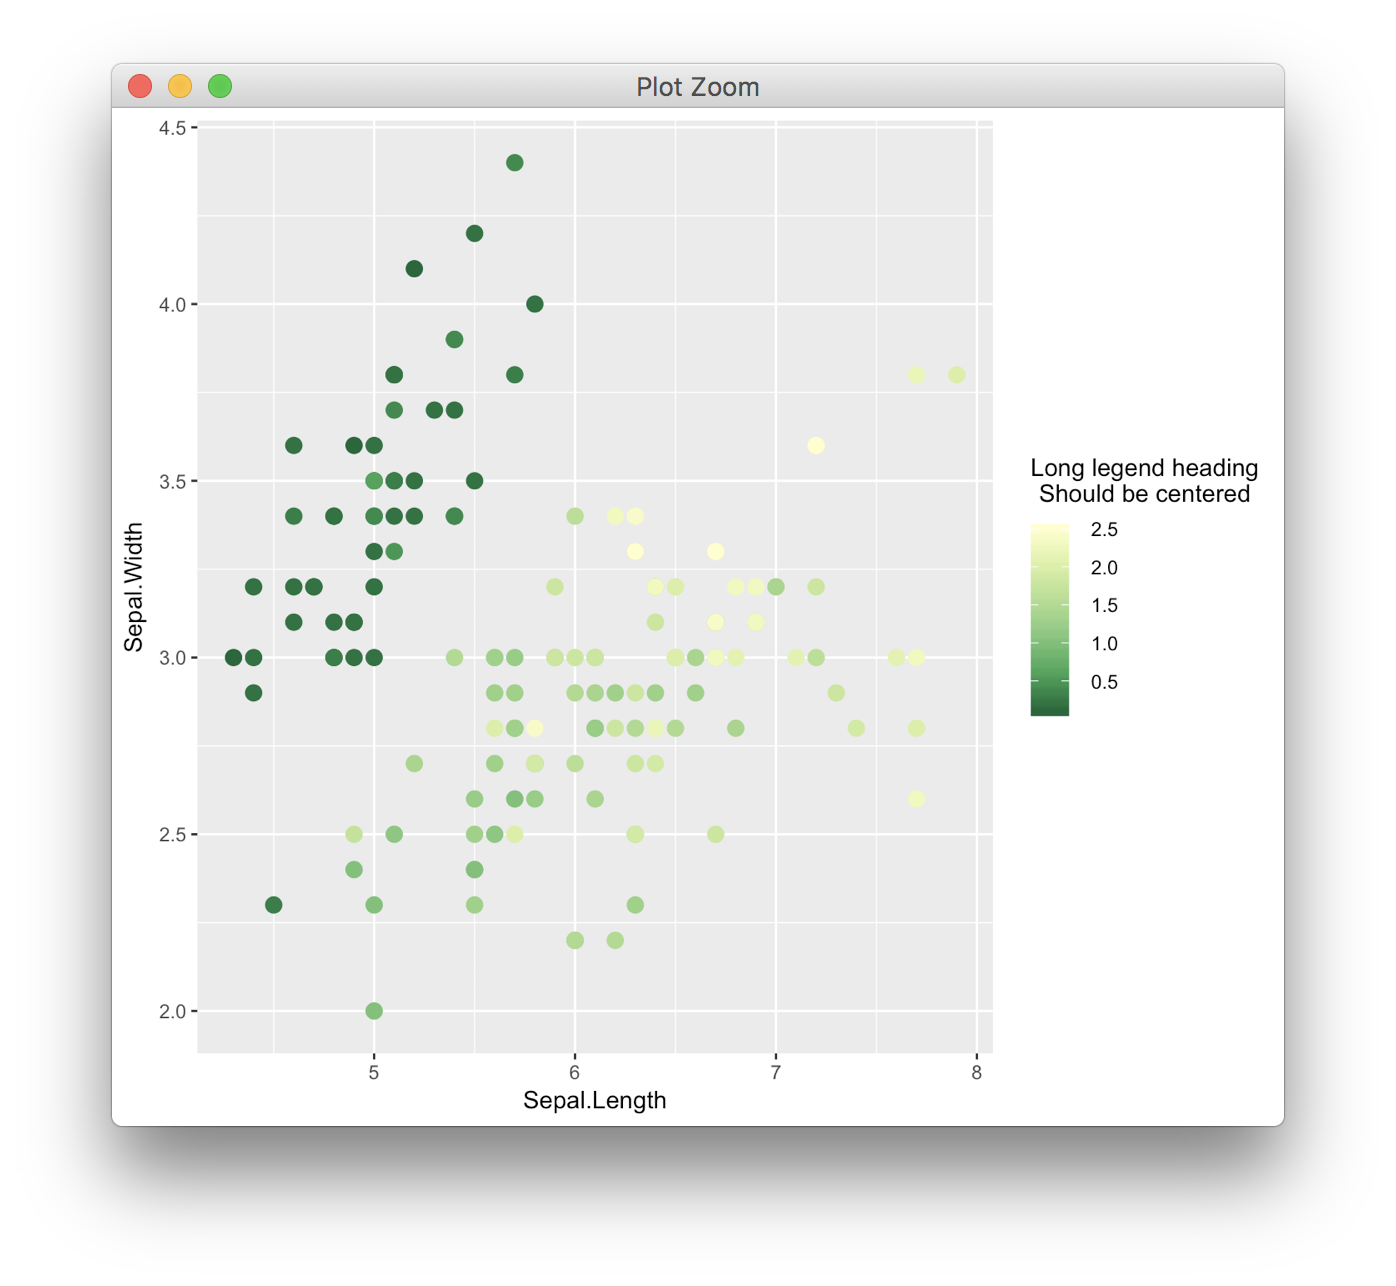
我们可以看到文本是中心对齐本身,而不是相对于图例键。我尝试过修改其他主题选项,比如legend.justification = "center",但是似乎没有人将键从图例框中最左边的位置移开。
以下是几点评论:
- 我正在运行几天前的ggplot2开发版本,v2.2.1.9000。
- 我特别需要一个连续的彩色调色板的解决方案。
回答 2
Stack Overflow用户
发布于 2019-10-01 17:05:40
我黑掉了类似于上述评论中的巴普蒂斯特描述方式的源代码:将颜色条/标签/滴答格罗布放入子gtable中,并将其定位为具有相同的行跨度/列跨度(取决于图例的方向)作为标题。
这仍然是一个黑客,但我想把它看作‘一次在整个会话’的方法,而不必重复每一个情节的步骤手动。
不同标题宽度/标题位置/图例方向的演示:
plot.demo <- function(title.width = 20,
                      title.position = "top",
                      legend.direction = "vertical"){
  ggplot(iris,
         aes(x=Sepal.Length, y=Sepal.Width, color=Petal.Width)) +
    geom_point(size = 3) +
    scale_color_distiller(palette = "YlGn",
                          name = stringr::str_wrap("Long legend heading should be centered",
                                                   width = title.width),
                          guide = guide_colourbar(title.position = title.position),
                          direction = -1) +
    theme(legend.title.align = 0.5,
          legend.direction = legend.direction)
}

cowplot::plot_grid(plot.demo(),
                   plot.demo(title.position = "left"),
                   plot.demo(title.position = "bottom"),
                   plot.demo(title.width = 10, title.position = "right"),
                   plot.demo(title.width = 50, legend.direction = "horizontal"),
                   plot.demo(title.width = 10, legend.direction = "horizontal"),
                   ncol = 2)
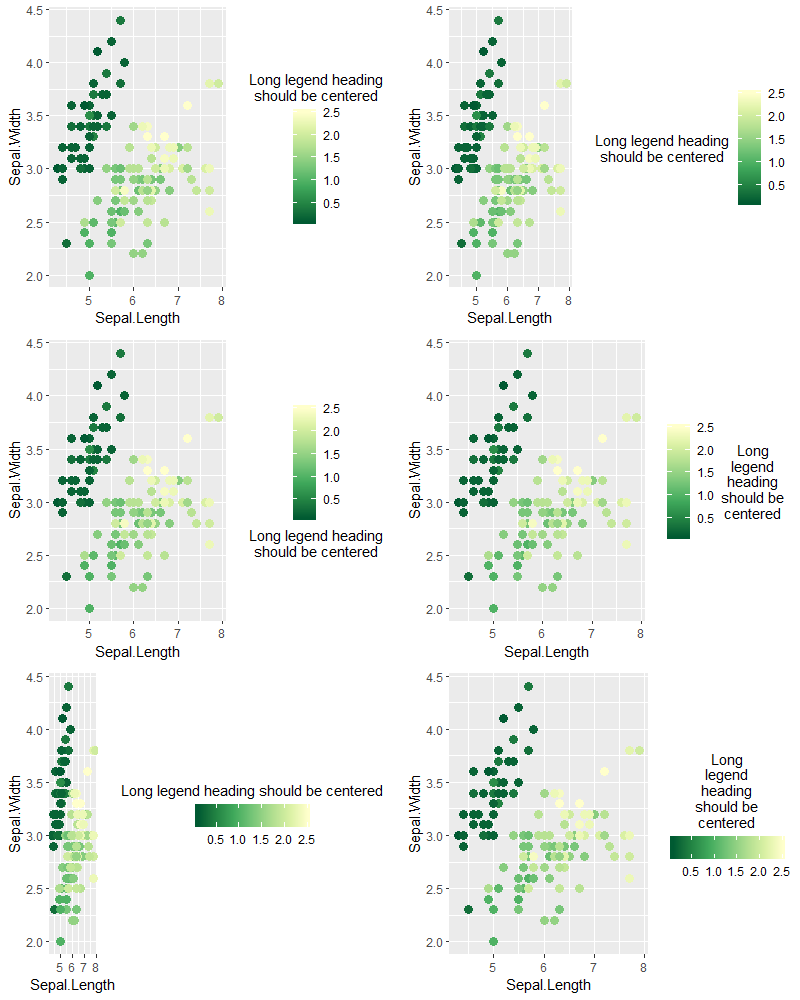
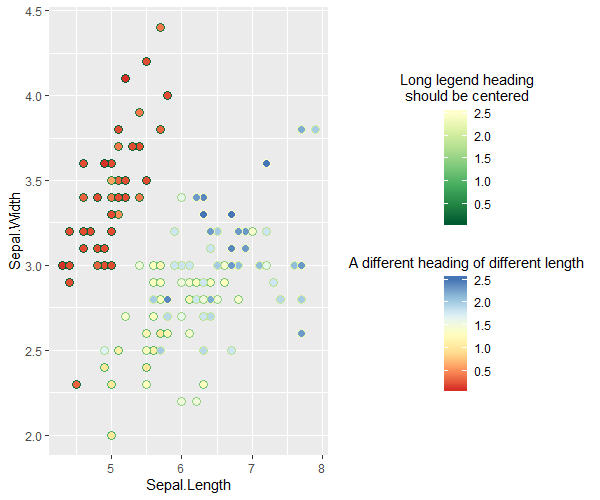
这也适用于多个彩条传说:
ggplot(iris,
       aes(x=Sepal.Length, y=Sepal.Width,
           color=Petal.Width, fill = Petal.Width)) +
  geom_point(size = 3, shape = 21) +
  scale_color_distiller(palette = "YlGn",
                        name = stringr::str_wrap("Long legend heading should be centered",
                                                 width = 20),
                        guide = guide_colourbar(title.position = "top"),
                        direction = -1) +
  scale_fill_distiller(palette = "RdYlBu",
                       name = stringr::str_wrap("A different heading of different length",
                                                width = 40),
                       direction = 1) +
  theme(legend.title.align = 0.5,
        legend.direction = "vertical",
legend.box.just = "center")(旁注:legend.box.just = "center"需要正确地对齐这两个传说。我担心了一段时间,因为目前只有"top“、”底部“、"left”和"right“被列为可接受的参数值,但事实证明,基础grid::valid.just也接受”中间“/”中心“。我不知道为什么在?theme帮助文件中没有明确提到这一点;尽管如此,它还是有效的。)
若要更改源代码,请运行:
trace(ggplot2:::guide_gengrob.colorbar, edit = TRUE)并将代码的最后一部分从以下内容中更改:
  gt <- gtable(widths = unit(widths, "cm"), heights = unit(heights,
    "cm"))
  ... # omitted
  gt
}
对此:
  # create legend gtable & add background / legend title grobs as before (this part is unchanged)
  gt <- gtable(widths = unit(widths, "cm"), heights = unit(heights, "cm"))
  gt <- gtable_add_grob(gt, grob.background, name = "background",
                        clip = "off", t = 1, r = -1, b = -1, l = 1)
  gt <- gtable_add_grob(gt, justify_grobs(grob.title, hjust = title.hjust,
                                          vjust = title.vjust, int_angle = title.theme$angle,
                                          debug = title.theme$debug), name = "title", clip = "off",
                        t = 1 + min(vps$title.row), r = 1 + max(vps$title.col),
                        b = 1 + max(vps$title.row), l = 1 + min(vps$title.col))

  # create child gtable, using the same widths / heights as the original legend gtable
  gt2 <- gtable(widths = unit(widths[1 + seq.int(min(range(vps$bar.col, vps$label.col)),
                                                 max(range(vps$bar.col, vps$label.col)))], "cm"),
                heights = unit(heights[1 + seq.int(min(range(vps$bar.row, vps$label.row)),
                                                   max(range(vps$bar.row, vps$label.row)))], "cm"))

  # shift cell positions to start from 1
  vps2 <- vps[c("bar.row", "bar.col", "label.row", "label.col")]
  vps2[c("bar.row", "label.row")] <- lapply(vps2[c("bar.row", "label.row")],
                                            function(x) x - min(unlist(vps2[c("bar.row", "label.row")])) + 1)
  vps2[c("bar.col", "label.col")] <- lapply(vps2[c("bar.col", "label.col")],
                                            function(x) x - min(unlist(vps2[c("bar.col", "label.col")])) + 1)

  # add bar / ticks / labels grobs to child gtable
  gt2 <- gtable_add_grob(gt2, grob.bar, name = "bar", clip = "off",
                         t = min(vps2$bar.row), r = max(vps2$bar.col),
                         b = max(vps2$bar.row), l = min(vps2$bar.col))
  gt2 <- gtable_add_grob(gt2, grob.ticks, name = "ticks", clip = "off",
                         t = min(vps2$bar.row), r = max(vps2$bar.col),
                         b = max(vps2$bar.row), l = min(vps2$bar.col))
  gt2 <- gtable_add_grob(gt2, grob.label, name = "label", clip = "off",
                         t = min(vps2$label.row), r = max(vps2$label.col),
                         b = max(vps2$label.row), l = min(vps2$label.col))

  # add child gtable back to original legend gtable, taking tlrb reference from the
  # rowspan / colspan of the title grob if title grob spans multiple rows / columns.
  gt <- gtable_add_grob(gt, justify_grobs(gt2, hjust = title.hjust,
                                          vjust = title.vjust),
                        name = "bar.ticks.label", clip = "off",
                        t = 1 + ifelse(length(vps$title.row) == 1,
                                       min(vps$bar.row, vps$label.row),
                                       min(vps$title.row)),
                        b = 1 + ifelse(length(vps$title.row) == 1,
                                       max(vps$bar.row, vps$label.row),
                                       max(vps$title.row)),
                        r = 1 + ifelse(length(vps$title.col) == 1,
                                       min(vps$bar.col, vps$label.col),
                                       max(vps$title.col)),
                        l = 1 + ifelse(length(vps$title.col) == 1,
                                       max(vps$bar.col, vps$label.col),
                                       min(vps$title.col)))
  gt
}
若要逆转更改,请运行:
untrace(ggplot2:::guide_gengrob.colorbar)使用的包版本: ggplot2 3.2.1。
Stack Overflow用户
发布于 2017-12-28 00:56:28
你必须修改源代码。目前它是计算标题grob和bar+labels的宽度,视图端口中的左-证明bar+labels是正确的 (gtable)。这是硬编码的。
https://stackoverflow.com/questions/48000292
复制相似问题
腾讯云开发者

Copyright © 2013 - 2026 Tencent Cloud. All Rights Reserved. 腾讯云 版权所有
深圳市腾讯计算机系统有限公司 ICP备案/许可证号:粤B2-20090059  粤公网安备44030502008569号
腾讯云计算(北京)有限责任公司 京ICP证150476号 | 京ICP备11018762号