
线上箭头
线上箭头
提问于 2017-12-19 11:03:44
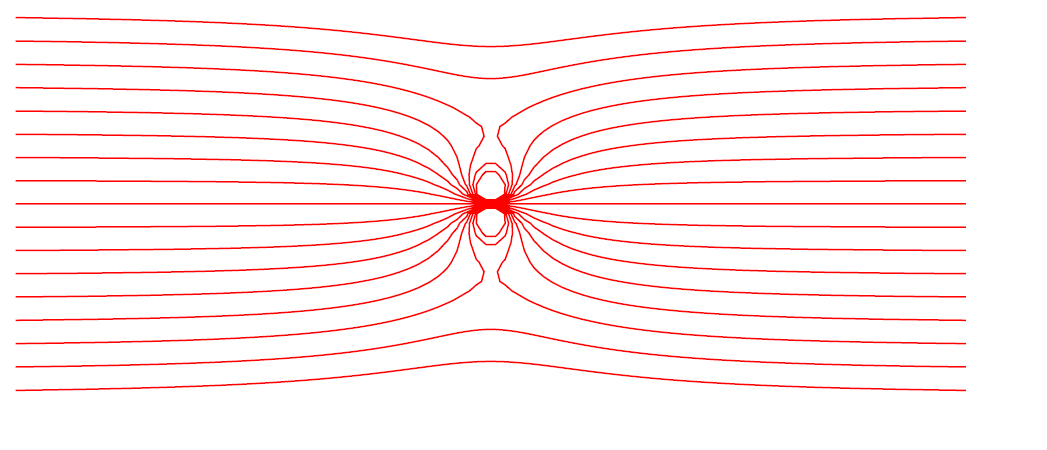
我有一个电场线的功能:
set isosamples 55, 55
set contour base
set cntrparam levels incremental -1.6,0.2,1.6
unset  surface
splot [-4:4] [-2.2:2.2] (y*(1+1/(x**2 + y**2)))
如何将箭头放在这条曲线上,sey在x=2的位置?
回答 1
Stack Overflow用户
回答已采纳
发布于 2017-12-20 10:26:34
实现这一目标的一种方法如下:
set isosamples 200, 200
set contour base
unset  surface
set cntrparam levels incremental -2,0.2,2

set xr [-4:4]
set yr [-3:3]

x_ref = 2

f(x,y) = (y*(1+1/(x**2 + y**2)))
g(x,y) = 2*x*y / ( (x*x + y*y)**2 + (x*x + y*y) - 2*y*y )

set table 'meta.levels.dat'
splot f(x, y)

set table 'meta.pnts.dat'
splot f(x_ref, y)

unset key
unset table
set terminal pngcairo enhanced size 600, 400
set output 'fig.png'

set style arrow 1 head filled size screen 0.01,30 fixed lc rgb 'dark-red'

set size ratio -1

delta = 0.01

plot \
    'meta.levels.dat' w l lc rgb 'black', \
    'meta.pnts.dat' every 1:1:0:0:0:0 u (x_ref-delta):($2-g(x_ref,$2)*delta):(delta):(g(x_ref,$2)*delta) with vectors as 1
战略是:
- 首先生成感兴趣函数的轮廓(上面脚本中的
f(x,y)),然后通过set table保存到文件中。 - 对于选定的
x值(例如x_ref=2),生成f(x_ref, y)的等高线。由于该函数不依赖于x,生成的等高线将仅仅是与x-轴平行的线,因此为了绘制与f(x,y)轮廓相交的点,只需取每个块的第一个点(每个等高线),然后用x-coordinate设置为x_ref绘制它。 - 将公式用于隐式函数的导数,计算等高线的斜率(此导数在上面定义为
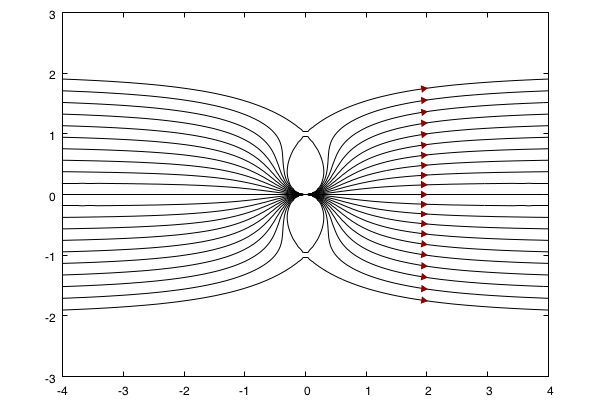
g(x,y))。 - 最后,我们有箭头的位置以及它们的斜率,这样就可以直接用
with vectors风格来绘制它。上面,delta参数指定了x-direction中的一个小位移--这是为了实现,箭头的头是可见的。
最后,图看起来如下:
页面原文内容由Stack Overflow提供。腾讯云小微IT领域专用引擎提供翻译支持
原文链接:
https://stackoverflow.com/questions/47885534
复制相关文章
相似问题
腾讯云开发者

Copyright © 2013 - 2026 Tencent Cloud. All Rights Reserved. 腾讯云 版权所有
深圳市腾讯计算机系统有限公司 ICP备案/许可证号:粤B2-20090059 ![]() 粤公网安备44030502008569号
粤公网安备44030502008569号
腾讯云计算(北京)有限责任公司 京ICP证150476号 | 京ICP备11018762号