
R(喜悦图)中使用ggridges的循环错误
R(喜悦图)中使用ggridges的循环错误
提问于 2017-12-18 06:56:05
我目前正在使用ggridges库,以便制作一个“欢乐图”。我写了这个:
data3 %>%
  mutate(ftFct = fct_rev(as.factor(ft_newnum))) %>%
  ggplot(aes(y = ftFct)) +
  geom_density_ridges(aes(x = ft, fill = paste(ftFct, rep)),
                      alpha = .8, color = "white", from = 0, to = 100) +
  labs(x = "Feeling Themometer Responses (%)",
   y = " ",
   title = "Republican vs Democratic Views Towards...",
   subtitle = "Analysis unit: students (n = 595)") +
   scale_y_discrete(expand = c(0.01, 0)) +
   scale_x_continuous(expand = c(0.01, 0)) +
   scale_fill_cyclical(breaks = c("2 0", "2 1"),
                       labels = c(`2 0` = "Democrat", `2 1` = "Republican"),
                       values = c("#8080ff", "#ff8080", "#0000ff", "#ff0000"),
                       name = "Political Affiliation", guide = "legend") +
  theme_ridges(grid = FALSE)
...which给了我这个数字:
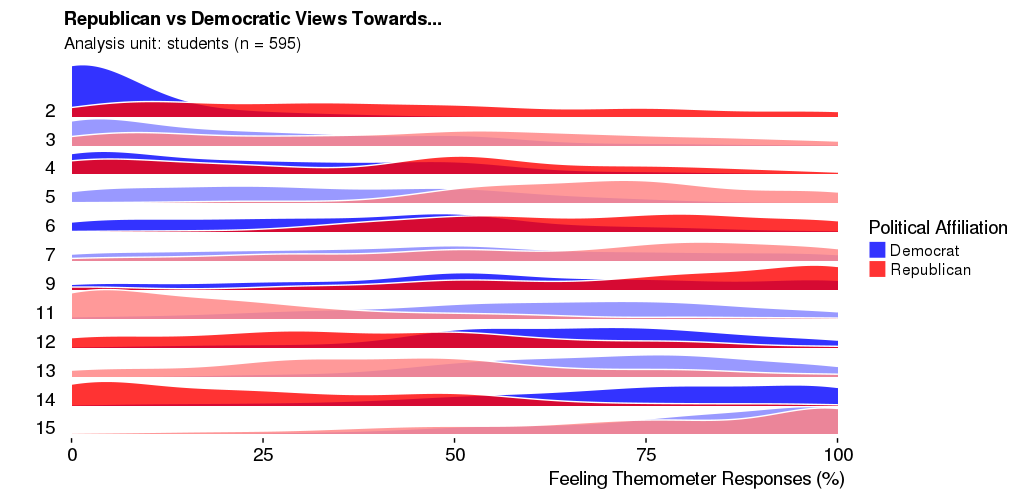
这正是我想要的-完美的格式,每一行在深色和浅色之间交替,提供一些对比和增加可读性。
接下来,我给y轴变量贴上标签,这样我们就知道我们在看什么了。我贴上“ft_newnum”的标签如下:
data3$ft_newnum <- factor(data3$ft_newnum,
                       levels = c(2,3,4,5,6,7,9,11,12, 13, 14, 15),
                       labels = c("Donald Trump", "Christian fundamentalists", "Elites", 'Republicans', 'Denison Republicans', 'Denison Greeks', 'Denison Varsity Athlete','Hillary Clinton', 'Denison Democrats', 'Democrats', 'Bernie Sanders', 'Weinberg'))
然后编辑代码以合并此更改:
data3 %>%
  mutate(ftFct = fct_rev(as.factor(ft_newnum))) %>%
  ggplot(aes(y = ftFct)) +
  geom_density_ridges(aes(x = ft, fill = paste(ftFct, rep)),
                      alpha = .8, color = "white", from = 0, to = 100) +
  labs(x = "Feeling Themometer Responses (%)",
       y = " ",
       title = "Republican vs Democratic Views Towards...",
       subtitle = "Analysis unit: students (n = 595)") +
  scale_y_discrete(expand = c(0.01, 0)) +
  scale_x_continuous(expand = c(0.01, 0)) +
  scale_fill_cyclical(breaks = c("Donald Trump 0", "Donald Trump 1"),
                      labels = c(`Donald Trump 0` = "Democrat", `Donald Trump 1` = "Republican"),
                      values = c("#8080ff", "#ff8080", "#0000ff", "#ff0000"),
                      name = "Political Affiliation", guide = "legend") +
  theme_ridges(grid = FALSE)
该代码绘制了这个数字:
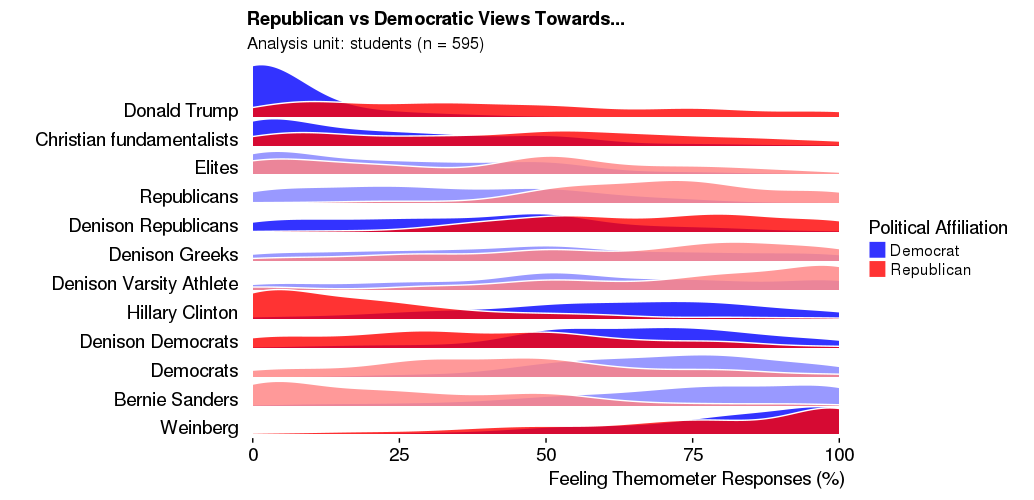
这几乎是完美的,但问题是,光和暗颜色之间的交替是关闭的。前两条线是深色的,后面是两条浅色线.我需要保留标签,但也保持准确的周期性变化,如第一个数字。
有什么想法吗?谢谢!
回答 2
Stack Overflow用户
发布于 2017-12-18 10:03:31
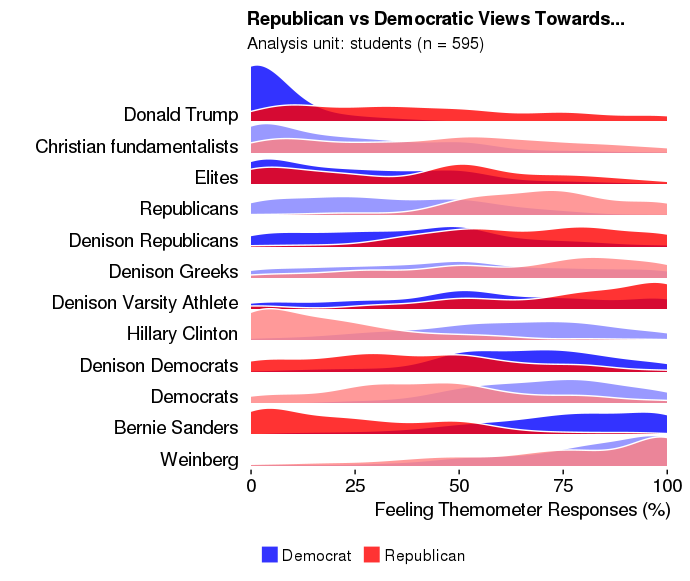
啊,我想出来了。不要覆盖'ft_newnum‘变量,而是创建一个新变量(ft_newnum2)。
data3$ft_newnum2 <- factor(data3$ft_newnum,
                       levels = c(2,3,4,5,6,7,9,11,12, 13, 14, 15),
                       labels = c("Donald Trump", "Christian fundamentalists", "Elites", 'Republicans', 'Denison Republicans', 'Denison Greeks', 'Denison Varsity Athlete','Hillary Clinton', 'Denison Democrats', 'Democrats', 'Bernie Sanders', 'Weinberg'))
ft_num2用于设置y轴,而原始ft_num则保持不变,并用于填充绘图。
data3 %>%
  mutate(ftFct = fct_rev(as.factor(ft_newnum2))) %>%
  ggplot(aes(y = ftFct)) +
  geom_density_ridges(aes(x = ft, fill = paste(ft_newnum, rep)),
                      alpha = .8, color = "white", from = 0, to = 100) +
  labs(x = "Feeling Themometer Responses (%)",
       y = " ",
       title = "Republican vs Democratic Views Towards...",
       subtitle = "Analysis unit: students (n = 595)") +
  scale_y_discrete(expand = c(0.01, 0)) +
  scale_x_continuous(expand = c(0.01, 0)) +
  scale_fill_cyclical(breaks = c("2 0", "2 1"),
                      labels = c(`Donald Trump 0` = "Democrat", `Donald Trump 1` = "Republican"),
                      values = c("#8080ff", "#ff8080", "#0000ff", "#ff0000"),
                      name = "Political Affiliation", guide = "legend") +
  theme_ridges(grid = FALSE) +
  theme(legend.position="bottom")
Stack Overflow用户
发布于 2019-03-19 23:35:11
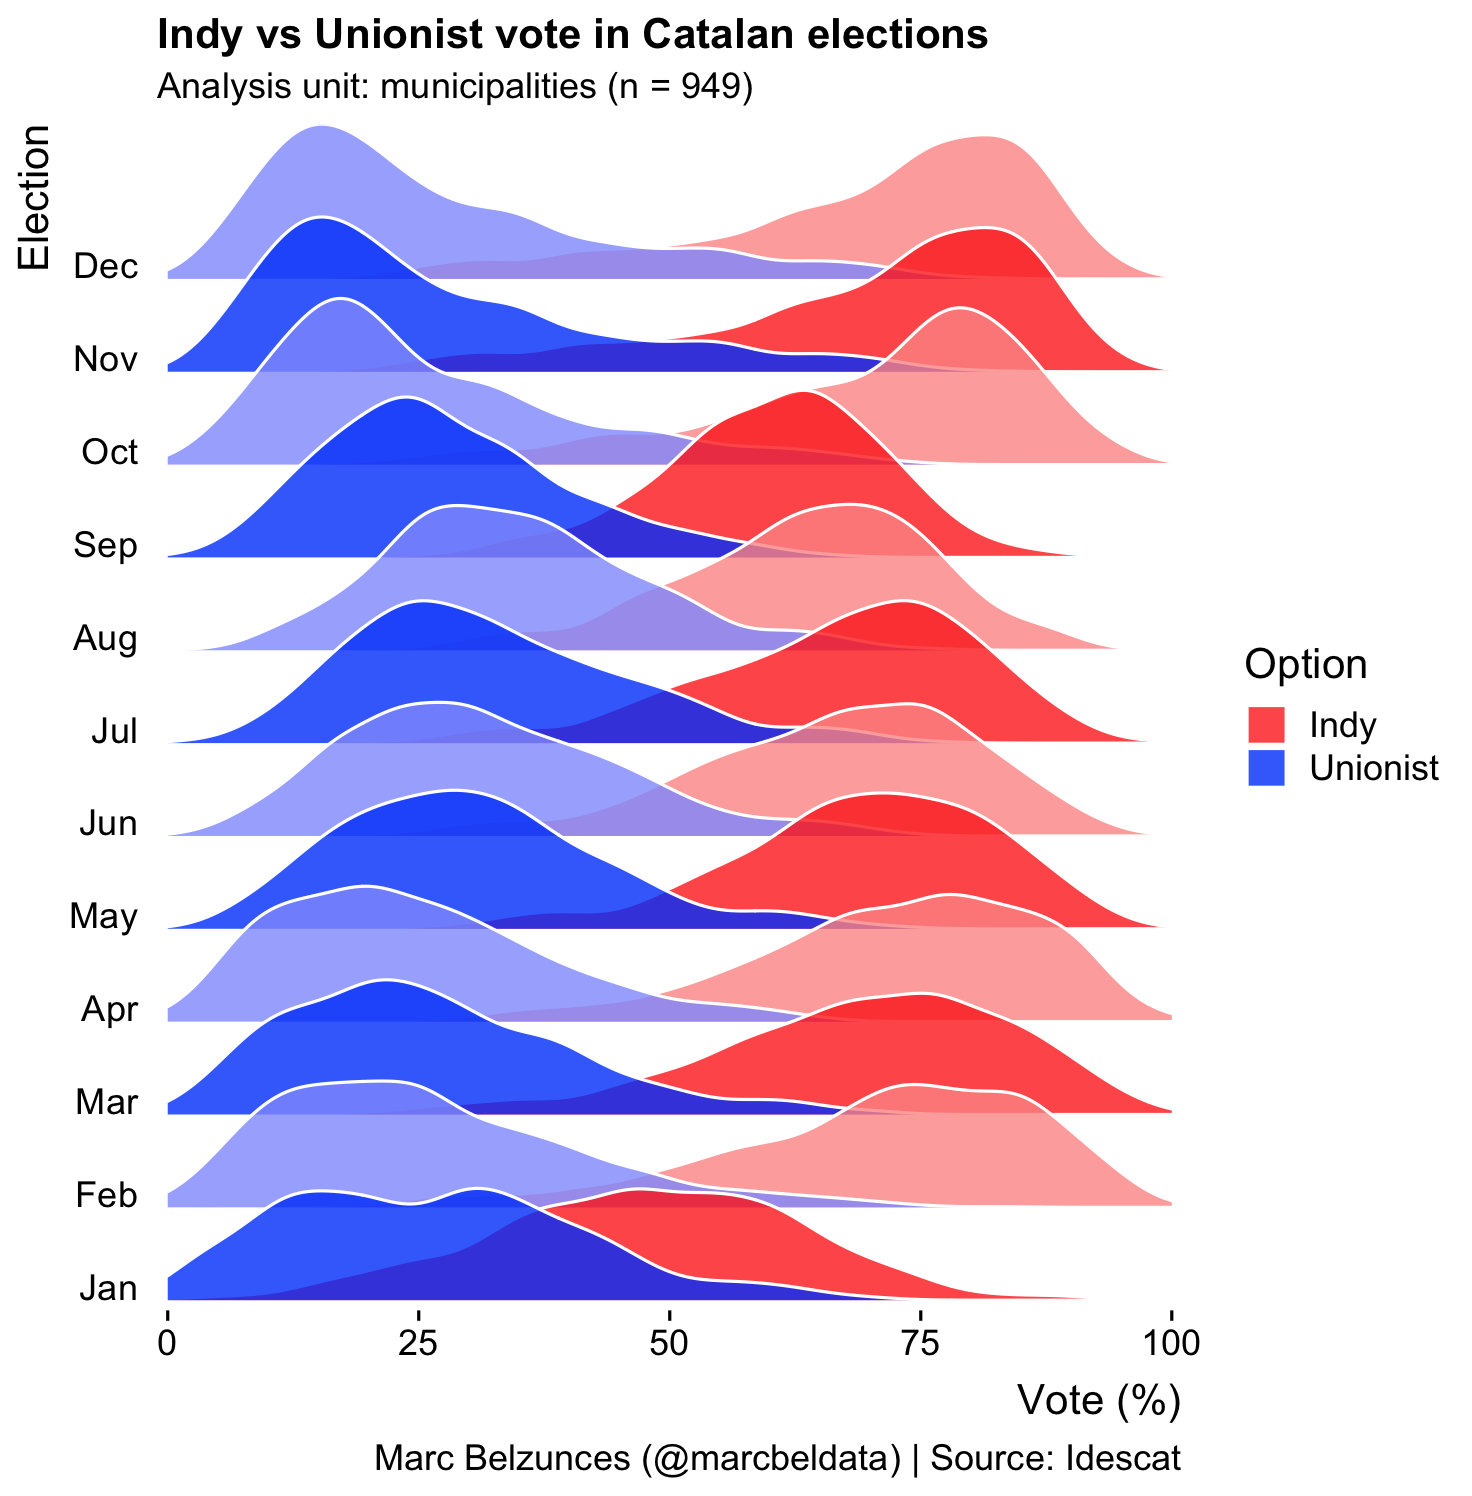
一个可重复的示例,展示了基于Catalan_elections示例/数据集在y轴上使用字符标签进行颜色交替的方法:
library(data.table)
library(dplyr)
library(forcats)
library(ggridges)
library(ggplot2)

# Making ggridges work with alternating colors and character labels
# in the y-axis.
# The key points are:

# 1. Make sure you create the character-column to use  as a factor, using levels from the numeric values matching the labels to be used in the y-axis (e.g. month.abb)
# 2. For the aes(y=) call use the factor column just created in the prev. step
# 3. And for the fill use the combination of the numeric value and the grouping variable


# Get "Catalan_elections" dataset as a data.table
dt_Catalan_elections <- as.data.table(Catalan_elections)
# Add a block of data to meet the 12 months and match it with number of unique years.
dt_n <- dt_Catalan_elections[Year==2015,]
dt_n[,Year:=2016]
dt_new <- rbindlist(list(dt_Catalan_elections, dt_n))
old <- as.character(unique(dt_new$Year))
# For each year assign a month (e.g. 1980 - Jan, 1981 - Feb, etc)
dt_new[,month := factor(Year, levels = old, labels = month.abb)]

# get ggridges using month instead of Year for Y-axis labels
p <- dt_new %>%
      ggplot(aes(y = month)) +
      geom_density_ridges(
        aes(x = Percent, fill = paste(Year, Option)),
        alpha = .8, color = "white", from = 0, to = 100
      ) +
      labs(
        x = "Vote (%)",
        y = "Election",
        title = "Indy vs Unionist vote in Catalan elections",
        subtitle = "Analysis unit: municipalities (n = 949)",
        caption = "Marc Belzunces (@marcbeldata) | Source: Idescat"
      ) +
      scale_y_discrete(expand = c(0.01, 0)) +
      scale_x_continuous(expand = c(0.01, 0)) +
      scale_fill_cyclical(
        breaks = c("1980 Indy", "1980 Unionist"),
        labels = c(`1980 Indy` = "Indy", `1980 Unionist` = "Unionist"),
        values = c("#ff0000", "#0000ff", "#ff8080", "#8080ff"),
        name = "Option", guide = "legend"
      ) +
      theme_ridges(grid = FALSE)
print(p)

##
页面原文内容由Stack Overflow提供。腾讯云小微IT领域专用引擎提供翻译支持
原文链接:
https://stackoverflow.com/questions/47863456
复制相关文章
相似问题
腾讯云开发者

Copyright © 2013 - 2026 Tencent Cloud. All Rights Reserved. 腾讯云 版权所有
深圳市腾讯计算机系统有限公司 ICP备案/许可证号:粤B2-20090059 ![]() 粤公网安备44030502008569号
粤公网安备44030502008569号
腾讯云计算(北京)有限责任公司 京ICP证150476号 | 京ICP备11018762号