
从信号对象获取峰的宽度和面积
从信号对象获取峰的宽度和面积
提问于 2017-12-16 16:07:34
如何利用cwt获取峰的方法从信号函数中得到具有位置、峰面积、峰宽等性质的峰值对象:
def CWT(trace):
x = []
y = []
for i in range(len(trace)):
    x.append(trace[i].Position)
    y.append(trace[i].Intensity)
x = np.asarray(x)
y = np.asarray(y)
return signal.find_peaks_cwt(x,y)
这只是返回一个数组?
回答 1
Stack Overflow用户
发布于 2017-12-16 17:50:38
首先,看起来您使用的find_peaks_cwt不正确。它的两个位置参数不是数据点的x和y坐标。第一个参数是y-值.X-值根本不取,它们假定为0,1,2,.第二个参数是您感兴趣的峰值宽度列表;
一维阵列宽度用于计算CWT矩阵.一般来说,这一范围应涵盖预期的峰值宽度。
width参数没有理由与数据数组大小相同。在下面的示例中,数据有500个值,但我使用的宽度是30.99。
第二,这种方法只查找峰值的位置(得到的数组有峰值的索引)。没有对它们的宽度和面积进行分析。你要么去别处看看(博客文章Python世界中的峰值检测列出了一些替代方案,尽管它们都没有返回你想要的数据),要么想出你自己的估算方法。
我的尝试是在下面。它做了以下工作:
- 将信号在峰值之间减少中点。
- 对于每一段,使用其中的值的中位数作为基线。
- 声明峰值由大于0.5*(峰值+基线)的所有值组成,即中间值和最大值之间。
- 找出山峰的起点和终点。(宽度就是这些的差别)
- 声明峰值的面积是(y -基线)在步骤4中发现的间隔的总和。
完整的例子:
t = np.linspace(0, 4.2, 500)
y = np.sin(t**2) + np.random.normal(0, 0.03, size=t.shape)  # simulated noisy signal
peaks = find_peaks_cwt(y, np.arange(30, 100, 10))

cuts = (peaks[1:] + peaks[:-1])//2    # where to cut the signal
cuts = np.insert(cuts, [0, cuts.size], [0, t.size])
peak_begins = np.zeros_like(peaks)
peak_ends = np.zeros_like(peaks)
areas = np.zeros(peaks.shape)
for i in range(peaks.size):
  peak_value = y[peaks[i]]
  y_cut = y[cuts[i]:cuts[i+1]]           # piece of signal with 1 peak
  baseline = np.median(y_cut)
  large = np.where(y_cut > 0.5*(peak_value + baseline))[0]
  peak_begins[i] = large.min() + cuts[i]
  peak_ends[i] = large.max() + cuts[i]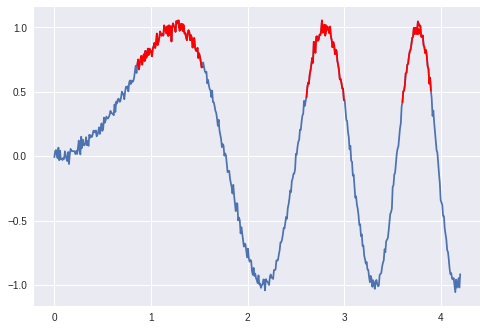
areas[i] = np.sum(y[peak_begins[i]:peak_ends[i]] - baseline)areas、peak_begins和peak_ends数组是这里感兴趣的。宽度为[84 47 36],表示峰值变薄(回想一下,这些是以索引单位表示的,宽度是峰值中数据点的数目)。我使用这些数据将峰值染成红色:
widths = peak_ends - peak_begins
print(widths, areas)
plt.plot(t, y)
for i in range(peaks.size):
  plt.plot(t[peak_begins[i]:peak_ends[i]], y[peak_begins[i]:peak_ends[i]], 'r')
plt.show()
页面原文内容由Stack Overflow提供。腾讯云小微IT领域专用引擎提供翻译支持
原文链接:
https://stackoverflow.com/questions/47847548
复制相关文章
相似问题
腾讯云开发者

Copyright © 2013 - 2026 Tencent Cloud. All Rights Reserved. 腾讯云 版权所有
深圳市腾讯计算机系统有限公司 ICP备案/许可证号:粤B2-20090059 ![]() 粤公网安备44030502008569号
粤公网安备44030502008569号
腾讯云计算(北京)有限责任公司 京ICP证150476号 | 京ICP备11018762号