
Python:使用多边形在给定的2d网格上创建掩码
我有一些多边形(加拿大省份),用GeoPandas读取,并希望使用它们创建一个掩码,应用于二维纬度-经度网格上的网格数据(使用iris从netcdf文件读取)。最终的目标将是只保留某一省份的数据,其余的数据将被屏蔽。因此,省内网格盒的掩码为1,省外网格盒的掩码为0或NaN。
多边形可以从以下的shapefile中获得:adm1.shp?dl=0
我使用的netcdf文件可以在这里下载:https://www.dropbox.com/s/kxb2v2rq17m7lp7/t2m.20090815.nc?dl=0
我想这里有两种方法,但我正在为这两种方法而奋斗:
1)使用多边形在经纬度网格上创建一个掩码,这样就可以将其应用于python以外的许多数据文件(首选)。
2)利用多边形掩蔽已读取的数据,仅提取感兴趣区域内的数据,进行交互工作。
到目前为止我的代码是:
import iris
import geopandas as gpd

#read the shapefile and extract the polygon for a single province
#(province names stored as variable 'NAME_1')
Canada=gpd.read_file('CAN_adm1.shp')
BritishColumbia=Canada[Canada['NAME_1'] == 'British Columbia']

#get the latitude-longitude grid from netcdf file
cubelist=iris.load('t2m.20090815.nc')
cube=cubelist[0]
lats=cube.coord('latitude').points
lons=cube.coord('longitude').points

#create 2d grid from lats and lons (may not be necessary?)
[lon2d,lat2d]=np.meshgrid(lons,lats)

#HELP!
非常感谢您的帮助和建议。
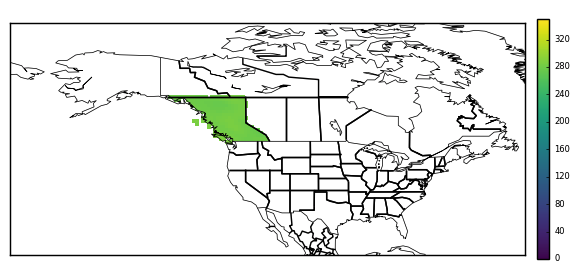
更新:按照下面@DPeterK提供的很好的解决方案,我的原始数据可以被屏蔽,提供如下内容:
回答 2
Stack Overflow用户
发布于 2017-12-14 12:17:11
看上去你开始得很好!从shapefile加载的几何图形公开了各种地理空间比较方法,在这种情况下,您需要contains方法。您可以使用这个测试立方体的水平网格中的每个点,以确定是否包含在不列颠哥伦比亚省的几何图形中。(请注意,这不是一个快速操作!)您可以使用此比较来构建一个2D掩码数组,该数组可以应用于多维数据集的数据,也可以以其他方式使用。
我编写了一个Python函数来完成上述工作--它需要一个多维数据集和一个几何图形,并为多维数据集的(指定的)水平坐标生成一个掩码,并将掩码应用到多维数据集的数据中。职能如下:
def geom_to_masked_cube(cube, geometry, x_coord, y_coord,
                        mask_excludes=False):
    """
    Convert a shapefile geometry into a mask for a cube's data.

    Args:

    * cube:
        The cube to mask.
    * geometry:
        A geometry from a shapefile to define a mask.
    * x_coord: (str or coord)
        A reference to a coord describing the cube's x-axis.
    * y_coord: (str or coord)
        A reference to a coord describing the cube's y-axis.

    Kwargs:

    * mask_excludes: (bool, default False)
        If False, the mask will exclude the area of the geometry from the
        cube's data. If True, the mask will include *only* the area of the
        geometry in the cube's data.

    .. note::
        This function does *not* preserve lazy cube data.

    """
    # Get horizontal coords for masking purposes.
    lats = cube.coord(y_coord).points
    lons = cube.coord(x_coord).points
    lon2d, lat2d = np.meshgrid(lons,lats)

    # Reshape to 1D for easier iteration.
    lon2 = lon2d.reshape(-1)
    lat2 = lat2d.reshape(-1)

    mask = []
    # Iterate through all horizontal points in cube, and
    # check for containment within the specified geometry.
    for lat, lon in zip(lat2, lon2):
        this_point = gpd.geoseries.Point(lon, lat)
        res = geometry.contains(this_point)
        mask.append(res.values[0])

    mask = np.array(mask).reshape(lon2d.shape)
    if mask_excludes:
        # Invert the mask if we want to include the geometry's area.
        mask = ~mask
    # Make sure the mask is the same shape as the cube.
    dim_map = (cube.coord_dims(y_coord)[0],
               cube.coord_dims(x_coord)[0])
    cube_mask = iris.util.broadcast_to_shape(mask, cube.shape, dim_map)

    # Apply the mask to the cube's data.
    data = cube.data
    masked_data = np.ma.masked_array(data, cube_mask)
    cube.data = masked_data
    return cube
如果您只需要2D掩码,您可以在上面的函数将其应用到多维数据集之前返回它。
若要在原始代码中使用此函数,请在代码末尾添加以下内容:
geometry = BritishColumbia.geometry
masked_cube = geom_to_masked_cube(cube, geometry,
                                  'longitude', 'latitude',
mask_excludes=True)如果这没有掩盖任何东西,那很可能意味着你的立方体和几何学是在不同的范围上定义的。也就是说,您的立方体的经度坐标在0°-360°之间运行,如果几何图形的经度值在-180°-180°之间运行,则包容测试将永远不会返回True。可以通过使用以下内容更改多维数据集的区段来修复此问题:
cube = cube.intersection(longitude=(-180, 180))Stack Overflow用户
发布于 2017-12-15 15:43:26
我在上面@DPeterK发布的优秀解决方案中找到了另一种解决方案,得到了同样的结果。它使用matplotlib.path测试点是否包含在从形状文件加载的几何描述的外部坐标中。我发这篇文章是因为这个方法比@DPeterK给出的方法快10倍(2:23分钟比25:56分钟)。我不确定更可取的是什么:一个优雅的解决方案,还是一个快速的、蛮力的解决方案。也许可以两者兼得?!
这种方法的一个复杂之处是,一些几何形状是MultiPolygons --即形状由几个较小的多边形组成(在这种情况下,不列颠哥伦比亚省包括西海岸以外的岛屿,这些岛屿无法用不列颠哥伦比亚省多边形的坐标来描述)。MultiPolygon没有外部坐标,但是每个多边形都有,因此每个多边形都需要单独处理。我发现对此最简洁的解决方案是使用从GitHub (https://gist.github.com/mhweber/cf36bb4e09df9deee5eb54dc6be74d26)复制的函数,该函数将MultiPolygons‘爆出’成一个单独的多边形列表,然后可以单独处理。
下面概述了工作代码和我的文档。很抱歉,它不是最优雅的代码--我对Python相对来说还是比较新的,而且我确信有很多不必要的循环/更整洁的方法来完成这些事情!
import numpy as np
import iris
import geopandas as gpd
from shapely.geometry import Point
import matplotlib.path as mpltPath
from shapely.geometry.polygon import Polygon
from shapely.geometry.multipolygon import MultiPolygon


#-----


#FIRST, read in the target data and latitude-longitude grid from netcdf file
cubelist=iris.load('t2m.20090815.minus180_180.nc')
cube=cubelist[0]
lats=cube.coord('latitude').points
lons=cube.coord('longitude').points

#create 2d grid from lats and lons
[lon2d,lat2d]=np.meshgrid(lons,lats)

#create a list of coordinates of all points within grid
points=[]

for latit in range(0,241):
    for lonit in range(0,480):
        point=(lon2d[latit,lonit],lat2d[latit,lonit])
        points.append(point)

#turn into np array for later
points=np.array(points)

#get the cube data - useful for later
fld=np.squeeze(cube.data)

#create a mask array of zeros, same shape as fld, to be modified by
#the code below
mask=np.zeros_like(fld)


#NOW, read the shapefile and extract the polygon for a single province
#(province names stored as variable 'NAME_1')
Canada=gpd.read_file('/Users/ianashpole/Computing/getting_province_outlines/CAN_adm_shp/CAN_adm1.shp')
BritishColumbia=Canada[Canada['NAME_1'] == 'British Columbia']


#BritishColumbia.geometry.type reveals this to be a 'MultiPolygon'
#i.e. several (in this case, thousands...) if individual polygons.
#I ultimately want to get the exterior coordinates of the BritishColumbia
#polygon, but a MultiPolygon is a list of polygons and therefore has no
#exterior coordinates. There are probably many ways to progress from here,
#but the method I have stumbled upon is to 'explode' the multipolygon into
#it's individual polygons and treat each individually. The function below
#to 'explode' the MultiPolygon was found here:
#https://gist.github.com/mhweber/cf36bb4e09df9deee5eb54dc6be74d26


#---define function to explode MultiPolygons

def explode_polygon(indata):
    indf = indata
    outdf = gpd.GeoDataFrame(columns=indf.columns)
    for idx, row in indf.iterrows():
        if type(row.geometry) == Polygon:
            #note: now redundant, but function originally worked on
            #a shapefile which could have combinations of individual polygons
            #and MultiPolygons
            outdf = outdf.append(row,ignore_index=True)
        if type(row.geometry) == MultiPolygon:
            multdf = gpd.GeoDataFrame(columns=indf.columns)
            recs = len(row.geometry)
            multdf = multdf.append([row]*recs,ignore_index=True)
            for geom in range(recs):
                multdf.loc[geom,'geometry'] = row.geometry[geom]
            outdf = outdf.append(multdf,ignore_index=True)
    return outdf

#-------


#Explode the BritishColumbia MultiPolygon into its constituents
EBritishColumbia=explode_polygon(BritishColumbia)


#Loop over each individual polygon and get external coordinates
for index,row in EBritishColumbia.iterrows():

    print 'working on polygon', index
    mypolygon=[]
    for pt in list(row['geometry'].exterior.coords):
        print index,', ',pt
        mypolygon.append(pt)


    #See if any of the original grid points read from the netcdf file earlier
    #lie within the exterior coordinates of this polygon
    #pth.contains_points returns a boolean array (true/false), in the
    #shape of 'points'
    path=mpltPath.Path(mypolygon)
    inside=path.contains_points(points)


    #find the results in the array that were inside the polygon ('True')
    #and set them to missing. First, must reshape the result of the search
    #('points') so that it matches the mask & original data
    #reshape the result to the main grid array
    inside=np.array(inside).reshape(lon2d.shape)
    i=np.where(inside == True)
    mask[i]=1


print 'fininshed checking for points inside all polygons'


#mask now contains 0's for points that are not within British Columbia, and
#1's for points that are. FINALLY, use this to mask the original data
#(stored as 'fld')
i=np.where(mask == 0)
fld[i]=np.nan

#Done.https://stackoverflow.com/questions/47781496
复制相似问题
腾讯云开发者

Copyright © 2013 - 2026 Tencent Cloud. All Rights Reserved. 腾讯云 版权所有
深圳市腾讯计算机系统有限公司 ICP备案/许可证号:粤B2-20090059 ![]() 粤公网安备44030502008569号
粤公网安备44030502008569号
腾讯云计算(北京)有限责任公司 京ICP证150476号 | 京ICP备11018762号