
使用rworldmap时地图绘制不完整
使用rworldmap时地图绘制不完整
提问于 2017-11-22 21:06:23
我有一些数据,我想用rworldmap绘制。正常情况下,这个很好用。但我搞不懂为什么当它说要做的时候,它没有把所有的数据都画出来。特别是它没有为美国绘制数据。
我在这里有一些数据:https://drive.google.com/file/d/1Fp7O2TRH5Blar56SqdRdcPh8Mb1Vb0pc/view?usp=sharing
我正在运行这个代码:
mergedData = readRDS("sampleData.rds")
changeHeatMapPalette = c('#D7191D', '#FDAE61', '#FFFFBF', '#ABD9E9', '#2C7BB6')
mapData = joinCountryData2Map(mergedData, joinCode="ISO2", nameJoinColumn="country", mapResolution = "high")
mapCountryData(mapData, nameColumnToPlot="change", mapTitle="", catMethod = "diverging", colourPalette = changeHeatMapPalette, numCats = 90, borderCol = "grey70")
但我得到了这张地图
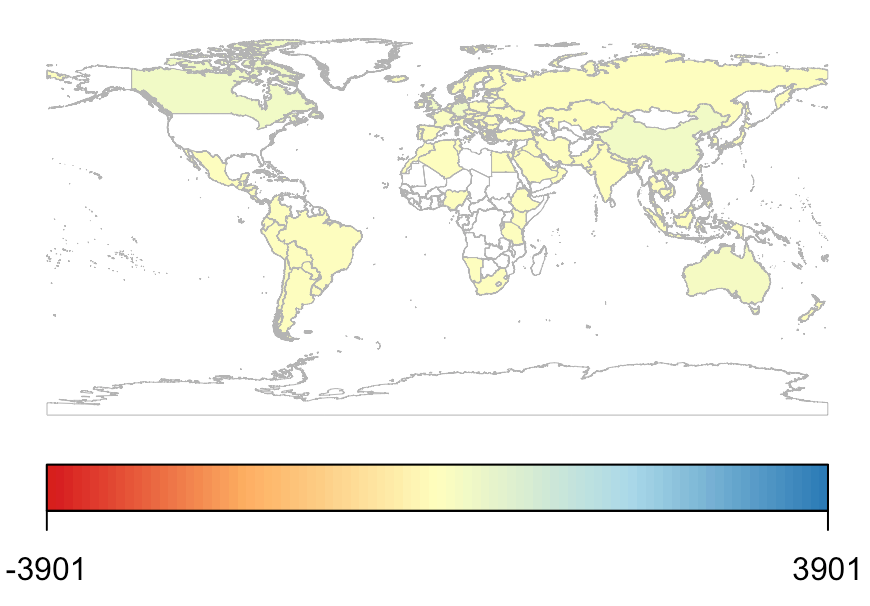
注意美国是如何没有数据的。但它肯定在样本数据中。它只排除了一个国家,而不是美国。
108 codes from your data successfully matched countries in the map
1 codes from your data failed to match with a country code in the map
     failedCodes
[1,] "GF"
143 codes from the map weren't represented in your data
知道我做错什么了吗?
回答 1
Stack Overflow用户
回答已采纳
发布于 2017-11-22 21:37:49
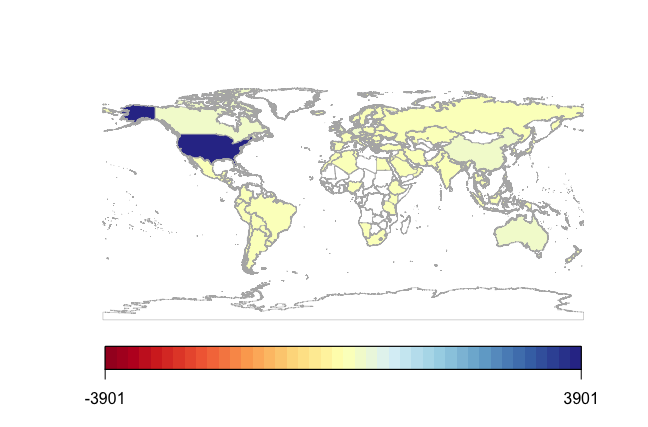
问题是您以相当随机的方式设置了colourPalette和numCats参数。
从您的数据中,我们确切地知道我们有多少个类别,可以用:length(table(mapData$change)和您需要的颜色来计算(如果您提供的颜色较少,那么mapCountData就会给它们加一个警告)。
话虽如此,你问题的一个解决办法是
mapCountryData(mapData,
  nameColumnToPlot="change",
  mapTitle="",
  catMethod = "diverging",
  colourPalette = brewer.pal(library(RColorBrewer), 'RdYlBu'),
  numCats = length(table(mapData$change)),
  borderCol = "grey70")
页面原文内容由Stack Overflow提供。腾讯云小微IT领域专用引擎提供翻译支持
原文链接:
https://stackoverflow.com/questions/47443881
复制相关文章
相似问题
腾讯云开发者

Copyright © 2013 - 2026 Tencent Cloud. All Rights Reserved. 腾讯云 版权所有
深圳市腾讯计算机系统有限公司 ICP备案/许可证号:粤B2-20090059 ![]() 粤公网安备44030502008569号
粤公网安备44030502008569号
腾讯云计算(北京)有限责任公司 京ICP证150476号 | 京ICP备11018762号