
角4使用高海图规
角4使用高海图规
提问于 2017-11-20 19:19:11
我使用的是角4 (4.4.4),“高图”:"~6.0.1",“angular2-高图”:"~0.5.5“。
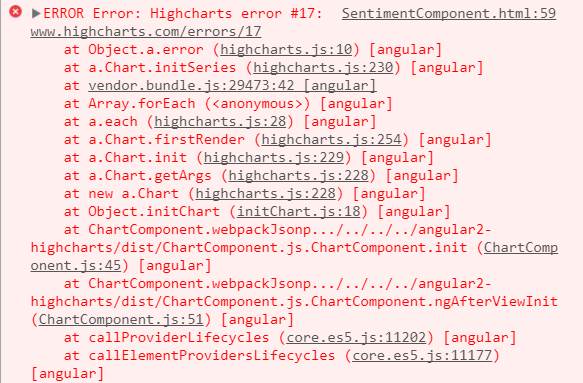
它能很好地显示简单的图表,但显示量规的错误如下
作为来自其他帖子的建议,我在appmodule.ts中有以下代码
import { ChartModule } from 'angular2-highcharts';
import { HighchartsStatic } from 'angular2-highcharts/dist/HighchartsService';

declare var require : any;

export function highchartsFactory() {
  const highcharts = require('highcharts');
  const highChartsMore = require('highcharts/highcharts-more');
  const solidGauge = require('highcharts/modules/solid-gauge');
  ChartModule.forRoot(require('highcharts'),
        require('highcharts/highcharts-more'),
        require('highcharts/modules/solid-gauge'));
  return highcharts;
}
有什么想法吗?谢谢
回答 2
Stack Overflow用户
发布于 2017-12-16 12:16:00
包括表图所需的额外模块
import { platformBrowserDynamic } from '@angular/platform-browser-dynamic';
import { NgModule, Component }    from '@angular/core';
import { BrowserModule }          from '@angular/platform-browser';
import { ChartModule }            from 'angular2-highcharts';
@Component({
  selector: 'my-app',
  styles: [`
      chart {
        display: block;
      }
    `],
  template: `<chart [options]="options"></chart>`
})
class AppComponent {
  constructor() {
    this.options = {
      chart: {
        type: 'solidgauge'
      },
      title: null,
      pane: {
        center: ['50%', '85%'],
        size: '140%',
        startAngle: -90,
        endAngle: 90,
        background: {

          innerRadius: '60%',
          outerRadius: '100%',
          shape: 'arc'
        }
      },
      tooltip: {
        enabled: false
      },
      // the value axis
      yAxis: {
        stops: [
          [0.1, '#55BF3B'], // green
          [0.5, '#DDDF0D'], // yellow
          [0.9, '#DF5353'] // red
        ],
        lineWidth: 0,
        minorTickInterval: null,
        tickAmount: 2,
        title: {
          y: -70
        },
        labels: {
          y: 16
        },
        min: 0,
        max: 200,
        title: {
          text: 'Speed'
        }
      },
      plotOptions: {
        solidgauge: {
          dataLabels: {
            y: 5,
            borderWidth: 0,
            useHTML: true
          }
        }
      },
      credits: {
        enabled: false
      },

      series: [{
        name: 'Speed',
        data: [80],
        tooltip: {
          valueSuffix: ' km/h'
        }
      }]
    };
  }
  options: Object;
}

@NgModule({
  imports: [
    BrowserModule,
    ChartModule.forRoot(
      require('highcharts'),
      require('highcharts/modules/exporting'),
      require('highcharts/highcharts-more'),
      require('highcharts/modules/solid-gauge')
    )
  ],
  declarations: [AppComponent],
  bootstrap: [AppComponent]
})
class AppModule {}


platformBrowserDynamic().bootstrapModule(AppModule);柱塞演示
Stack Overflow用户
发布于 2018-05-08 21:11:37
Install highcharts-more

import { Component, OnInit } from '@angular/core';
import * as Highcharts from 'highcharts';
import * as ChartModuleMore from 'highcharts-more';
ChartModuleMore(Highcharts);页面原文内容由Stack Overflow提供。腾讯云小微IT领域专用引擎提供翻译支持
原文链接:
https://stackoverflow.com/questions/47399489
复制相关文章
相似问题
腾讯云开发者

Copyright © 2013 - 2026 Tencent Cloud. All Rights Reserved. 腾讯云 版权所有
深圳市腾讯计算机系统有限公司 ICP备案/许可证号:粤B2-20090059 ![]() 粤公网安备44030502008569号
粤公网安备44030502008569号
腾讯云计算(北京)有限责任公司 京ICP证150476号 | 京ICP备11018762号