
如何在MATLAB中改变边缘颜色?
如何在MATLAB中改变边缘颜色?
提问于 2017-11-20 14:44:17
我有一个脚本,它将一幅图像应用于一些边缘检测方法,如canny、sobel和log。当我运行文件时,会绘制一个图形,其中的边缘是白色的。
是否有办法将边缘的颜色更改为首选的颜色?
function cw1
  im0 = imread('lighthouse.png');
  im = rgb2gray(im0);
  im3 = edge(im,'canny');
  im4 = edge(im, 'sobel');
  im5 = edge(im, 'log');
  im2 = my_edge1(im);
  subplot(3,2,1), subimage(im); title ('Original'); axis off
  subplot(3,2,2), subimage(im2); title ('My Edge'); axis off
  subplot(3,2,3), subimage(im3); title ('Canny'); axis off
  subplot(3,2,4), subimage(im4); title ('Sobel'); axis off
  subplot(3,2,5), subimage(im5); title ('Log'); axis off
end回答 1
Stack Overflow用户
回答已采纳
发布于 2017-11-20 15:20:32
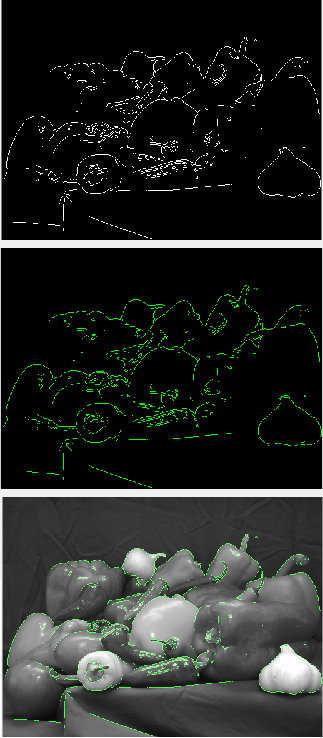
问题不是很明确,但无论如何我都会尽力帮忙的。下面是一个使用绿色边缘的演示:
function q47394633
  im = rgb2gray(imread('peppers.png'));
  e = edge(im); % logical matrix, where "true" indicates an edge.
  g = reshape(uint8([0 255 0]),[1,1,3]) .* uint8(e); % Turn the above to RGB while making
  figure();                                          % only the green channel nonzero.
  subplot(3,1,1); imshow(e);    % Show white edges
  subplot(3,1,2); imshow(g);    % Show green edges
  subplot(3,1,3); imshow(im+g); % Show green edges on the image
end
页面原文内容由Stack Overflow提供。腾讯云小微IT领域专用引擎提供翻译支持
原文链接:
https://stackoverflow.com/questions/47394633
复制相关文章
相似问题
腾讯云开发者

Copyright © 2013 - 2026 Tencent Cloud. All Rights Reserved. 腾讯云 版权所有
深圳市腾讯计算机系统有限公司 ICP备案/许可证号:粤B2-20090059 ![]() 粤公网安备44030502008569号
粤公网安备44030502008569号
腾讯云计算(北京)有限责任公司 京ICP证150476号 | 京ICP备11018762号