
如何控制y轴上geom_text的间距/缩放?
如何控制y轴上geom_text的间距/缩放?
提问于 2017-11-06 22:28:27
我不知道如何控制ggplot2中“行”之间的文本间距。例如,下面的函数在一个空网格上绘制了几行文本:
library(tidyverse)
plot_text <- function(rows) {
  tibble(text = sprintf("Line %s", 1:rows),
         x = 1,
         y = rev(1:rows)) %>%
    ggplot(aes(x, y)) +
    geom_text(aes(label = text)) +
    theme_void() +
    ylim(-5, rows) #I want to leave some whitespace on the bottom
}
但是,每个“行”之间的间距因行数而异:
plot_text(rows = 5)
plot_text(rows = 10)
plot_text(rows = 20)
如何锁定或控制行间距,以使文本始终缩放相同,无论行数?
回答 1
Stack Overflow用户
回答已采纳
发布于 2017-11-06 22:50:21
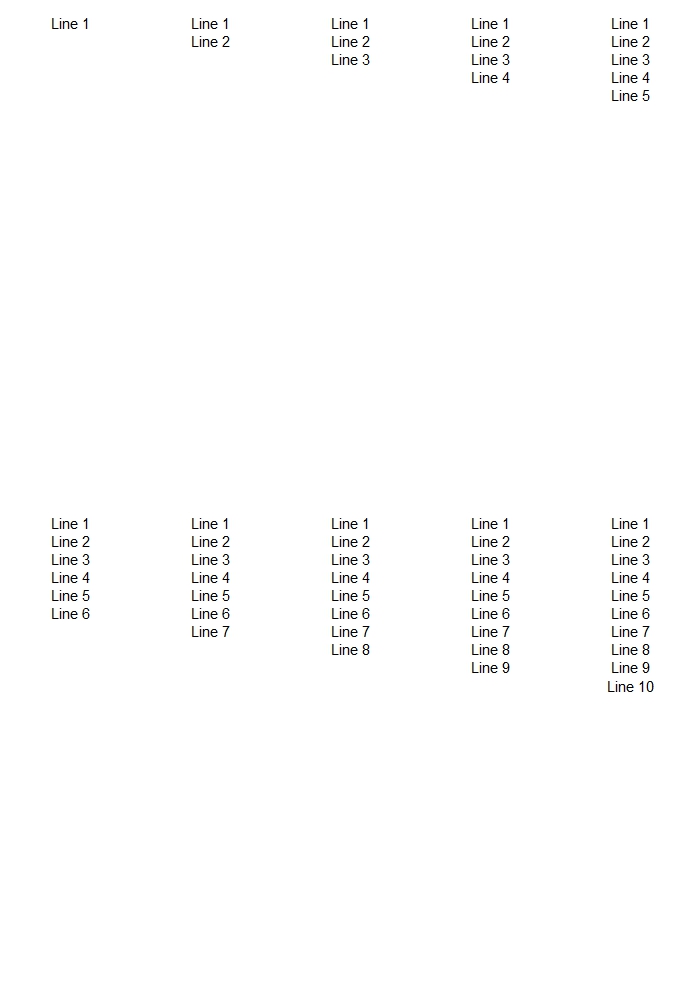
我使用变量ylim所做的任何尝试都被证明是不一致的,所以我决定修复ylim并遵循这一点:
library(tidyverse)
plot_text <- function(rows) {
  if(rows < 1){
    stop ("try again")}
  if(rows == 1){
    g = 20
  } else { g = c(20,20-1*(1:(rows-1)))}
  tibble(text = sprintf("Line %s", 1:rows),
         x = 1,
         y = g) %>%
    ggplot(aes(x, y = y)) +
    geom_text(aes(label = text)) +
    theme_void()+
    ylim(-5, 20)
}
library(gridExtra)
do.call("grid.arrange", c(lapply(1:10, function(x) plot_text(x)), ncol = 5))
页面原文内容由Stack Overflow提供。腾讯云小微IT领域专用引擎提供翻译支持
原文链接:
https://stackoverflow.com/questions/47146902
复制相关文章
相似问题
腾讯云开发者

Copyright © 2013 - 2026 Tencent Cloud. All Rights Reserved. 腾讯云 版权所有
深圳市腾讯计算机系统有限公司 ICP备案/许可证号:粤B2-20090059  粤公网安备44030502008569号
腾讯云计算(北京)有限责任公司 京ICP证150476号 | 京ICP备11018762号