
R闪亮:从网页中读取CSV,readTableHeader找到的不完整的最后一行
R闪亮:从网页中读取CSV,readTableHeader找到的不完整的最后一行
提问于 2017-10-25 23:21:32
我有一个问题,我似乎找不到解决办法。我正在从web上的URL中读取一个CSV,这个URL有点像这样(真正的URL还有4列):
来自CSV的样本数据 约会 2017年-10-23 2017年-10-20 2017年-10-19 2017年-10-18 2017年-10-17 2017年-10-16 2017年-10-13 2017年-10-12 2017年-10-11
CSV文件会像这样继续下去(每天都有记录),直到1980年。在R like中,我使用了这样的绘图命令.
stockData <- read.csv(url("https://www.quandl.com/api/v3/datasets/WIKI/FB/data.json?api_key=xTLatSPBnz751sCMECza"), header=T, sep=",")然后,...and继续使用以下代码:
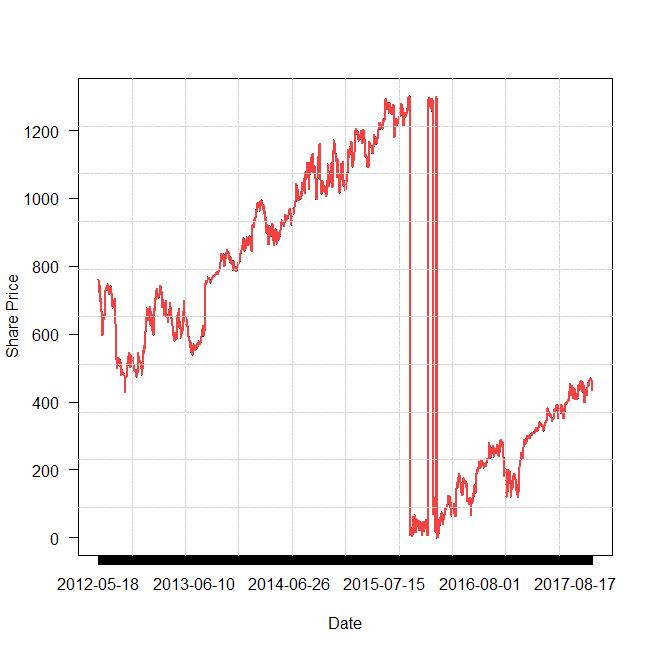
plot(stockData$Date, stockData$Close, main="", type="l", las="1",
      xlab="Date", ylab="Share Price", panel.first = grid())
      points(x=stockData$Date, y=stockData$Close, col='#f44242', type='l', lwd=2)
      grid (10,10, lty = 6, col = "lightgray")
...I得到以下错误:
Warning in read.table(file = file, header = header, sep = sep, quote = quote,  :
  incomplete final line found by readTableHeader on 'https://www.quandl.com/api/v3/datasets/WIKI/FB/data.json?api_key=xTLatSPBnz751sCMECza'
Warning in min(x) : no non-missing arguments to min; returning Inf
Warning in max(x) : no non-missing arguments to max; returning -Inf
Warning in min(x) : no non-missing arguments to min; returning Inf
Warning in max(x) : no non-missing arguments to max; returning -Inf
Warning: Error in plot.window: need finite 'xlim' values我不知道哪些错误是相关的,所以如果有人能解释我做错了什么,那就太棒了。是因为文件太大了吗?我怎么测试它呢?或者它与此完全无关吗?(注:我下载了CSV并链接到同一个(大)文件,并且它工作了)。
回答 1
Stack Overflow用户
回答已采纳
发布于 2017-10-26 08:24:05
正在读取的文件是一个json,需要对其进行解析,然后将其转换为dataframe。同样,请使用以下代码:
library(jsonlite)

df <- fromJSON("https://www.quandl.com/api/v3/datasets/WIKI/FB/data.json?api_key=xTLatSPBnz751sCMECza", flatten = T)

stockData <- data.frame(df$dataset_data$data)

names(stockData) <- df$dataset_data$column_names

stockData$Close <- as.numeric(stockData$Close)

plot(stockData$Date, stockData$Close, main="", type="l", las="1",
     xlab="Date", ylab="Share Price")
points(x=stockData$Date, y=stockData$Close, col='#f44242', type='l', lwd=2)
grid (10,10, lty = 6, col = "lightgray")
页面原文内容由Stack Overflow提供。腾讯云小微IT领域专用引擎提供翻译支持
原文链接:
https://stackoverflow.com/questions/46943489
复制相关文章
相似问题
腾讯云开发者

Copyright © 2013 - 2026 Tencent Cloud. All Rights Reserved. 腾讯云 版权所有
深圳市腾讯计算机系统有限公司 ICP备案/许可证号:粤B2-20090059 ![]() 粤公网安备44030502008569号
粤公网安备44030502008569号
腾讯云计算(北京)有限责任公司 京ICP证150476号 | 京ICP备11018762号