
ggplot2:如何与第三列匹配标准错误和值
我有这个表(下面),我已经把它转换成了宽到长的表,我想用logFPKM(Geom_bar)为每个按"gene_id“分组的”样本“绘制”ggplot2“。另外,我想相应地匹配每个样例-logFPKM的标准错误("se")。这是我桌子的头:
gene_id        sample logFPKM            se
PCBA_RS20130   CW     2.82138999505533   0.0510157917418624
PCBA_RS20130   CW     2.82138999505533   0.0614430466292
PCBA_RS20130   CW     2.82138999505533   0.15767922584651
PCBA_RS20130   W24    3.30091961220465   0.0510157917418624
PCBA_RS20130   W24    3.30091961220465   0.0614430466292
PCBA_RS20130   W24    3.30091961220465   0.15767922584651
PCBA_RS20130   W72    3.03503118006935   0.0510157917418624
PCBA_RS20130   W72    3.03503118006935   0.0614430466292
PCBA_RS20130   W72    3.03503118006935   0.15767922584651
PCBA_RS20135   CW     6.9229217846409    0.00450698521094983
PCBA_RS20135   CW     6.9229217846409    0.0224906710108503
PCBA_RS20135   CW     6.9229217846409    0.0917704536947984
PCBA_RS20135   W24    6.84058248620209   0.00450698521094983
PCBA_RS20135   W24    6.84058248620209   0.0224906710108503
PCBA_RS20135   W24    6.84058248620209   0.091770453694798
PCBA_RS20135   W72    5.95705243892052   0.00450698521094983
PCBA_RS20135   W72    5.95705243892052   0.0224906710108503
PCBA_RS20135   W72    5.95705243892052   0.0917704536947984
现在的代码(下面)成功地获取了sample (x)列中每个类(CW、W24、W72)的W24 (y)值。但是,每个logFPKM条都要绘制三次"se“值。我正在努力使"logFPKM“和"se”‘一起走’与示例类。如何将每个“示例”类(CW、W24、W72)的"se“值正确地关联到每个logFPKM?
ggplot(both_long, aes(x=sample,y=logFPKM,fill=factor(gene_id), ymax=logFPKM+se, ymin=logFPKM-se)) +
  geom_bar(position = "dodge", stat = "identity") +
  geom_errorbar(position = "dodge")
下面是ggplot2输出的样子:
这是dput:
dput(both_long)结构(V1=结构(c( 1L,1L,1L,1L,1L,1L,1L,1L,1L, 1L,2L,2L,2L,2L,2L,2L,2L,2L,2L),.Label = c("PCBA_RS20130", (PCBA_RS20135),V2 =结构(c( 1L,1L, 1L,2L,2L,2L,3L,3L,3L,1L,1L,1L,2L,2L,2L,3L,3L,3L ),.Label = c("CW","W24","W72"),V3 = c(2.82138999505533, 2.82138999505533,2.82138999505533,3.30091961220465,3.30091961220465, 3.30091961220465,3.03503118006935,3.03503118006935,3.03503118006935, 6.9229217846409,6.9229217846409,6.9229217846409,6.84058248620209 6.84058248620209,6.84058248620209,5.95705243892052,5.95705243892052, ,V4 = c(0.0510157917418624,0.0614430466292, 0.15767922584651,0.0510157917418624,0.0614430466292,0.15767922584651, 0.0510157917418624,0.0614430466292,0.15767922584651,0.00450698521094983, 0.0224906710108503,0.0917704536947984,0.00450698521094983, 0.0224906710108503,0.0917704536947984,0.00450698521094983, ),.Names = c("V1","V2", "V3","V4"),class = "data.frame",row.names = c(NA,-18L)
谢谢大家的欢呼声
回答 1
Stack Overflow用户
发布于 2017-10-25 08:59:28
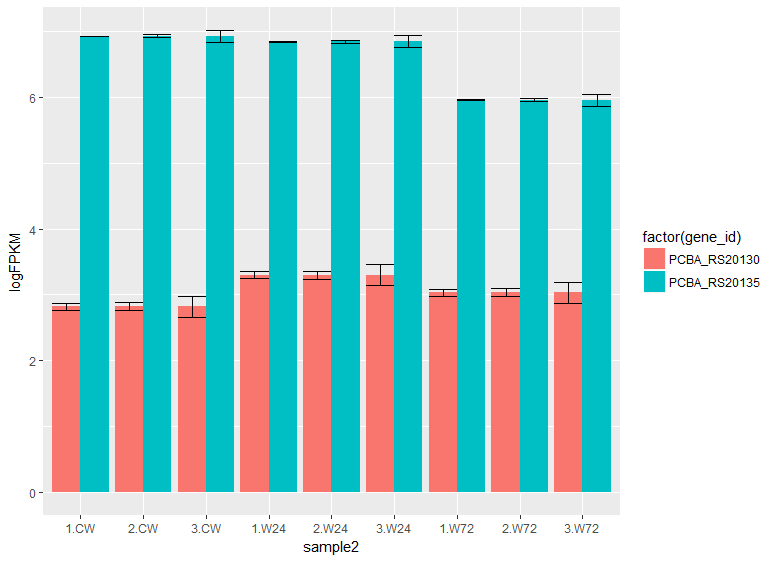
如前所述,在您的数据中,每个样本和具有不同se's的基因都有三个相同的logFPKM值。因此,您可以尝试使用交互方式独立地绘制每个值:
library(tidyverse)
both_long %>%
  group_by(gene_id, sample) %>%
  mutate(sample2=interaction(1:n(),sample)) %>%
  ggplot(aes(x=sample2,y=logFPKM,fill=factor(gene_id), ymax=logFPKM+se, ymin=logFPKM-se)) +
  geom_col(position = "dodge") +
  geom_errorbar(position = "dodge")
https://stackoverflow.com/questions/46926920
复制相似问题
腾讯云开发者

Copyright © 2013 - 2026 Tencent Cloud. All Rights Reserved. 腾讯云 版权所有
深圳市腾讯计算机系统有限公司 ICP备案/许可证号:粤B2-20090059 ![]() 粤公网安备44030502008569号
粤公网安备44030502008569号
腾讯云计算(北京)有限责任公司 京ICP证150476号 | 京ICP备11018762号