
d3.js在图例中水平绘制矩形框
d3.js在图例中水平绘制矩形框
提问于 2017-10-15 11:18:15
我想在图表上水平地展示传奇,我做了这样的事情:
var legend = svg.selectAll(".legend")
    .data(color.domain())
    .enter().append("g")
    .attr("class", "legend")
    .attr("transform", function(d, i) {
        return "translate(0," + i * 30 +
            ")";
    });

legend.append("rect")
    .attr("x", function(d, i) {
        return (i * 150) + 400;
    })
    .attr("y", function(d, i) {
        return 350;
    })
    .attr("width", 18)
    .attr("height", 18)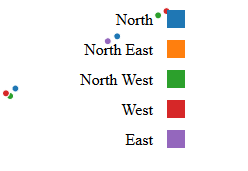
.style("fill", color);我的数据看起来像Rect1 - North, Rect-2 - North East,这里的问题只是散点图上的图例框对齐。
回答 1
Stack Overflow用户
回答已采纳
发布于 2017-10-15 11:56:08
横向绘制图例的最大问题是文本:由于North West比East大,所以不能简单地硬编码要转换的值。
在这个解决方案中,我将使用getComputedTextLength (顾名思义)获取每个文本的长度,并使用D3局部变量存储这些值。
因此,当我绘制文本时,我将它们的长度存储在父<g>元素中:
var local = d3.local();

legend.append("text")
  .text(String)
  .attr("y", function() {
    local.set(this.parentNode, this.getComputedTextLength())
    return 20;
  });
之后,我用这个值来画长方形.
legend.append("rect")
  .attr("x", function() {
    return local.get(this.parentNode) + 4
  });
..。并翻译这些小组:
legend.each(function(d, i) {
  if (i) {
    d3.select(this).attr("transform", "translate(" +
        (counter += local.get(this.previousSibling) + 36) + ",0)")
  }
})
下面是一个使用这些数据的演示:
["North", "North East", "North West", "West", "East"];
var svg = d3.select("svg");
var data = ["North", "North East", "North West", "West", "East"];
var colors = d3.scaleOrdinal(d3.schemeCategory10);
var local = d3.local();
var legend = svg.selectAll(null)
  .data(data)
  .enter()
  .append("g");

legend.append("text")
  .text(String)
  .attr("y", function() {
    local.set(this.parentNode, this.getComputedTextLength())
    return 20;
  });

legend.append("rect")
  .style("fill", function(d, i) {
    return colors(i)
  })
  .attr("x", function() {
    return local.get(this.parentNode) + 4
  })
  .attr("y", 6)
  .attr("width", 18)
  .attr("height", 18);

var counter = 0;

legend.each(function(d, i) {
  if (i) {
    d3.select(this).attr("transform", "translate(" + (counter += local.get(this.previousSibling) + 36) + ",0)")
  }
})<script src="https://d3js.org/d3.v4.min.js"></script>
<svg width="500" height="100"></svg>
页面原文内容由Stack Overflow提供。腾讯云小微IT领域专用引擎提供翻译支持
原文链接:
https://stackoverflow.com/questions/46754449
复制相关文章
相似问题
腾讯云开发者

Copyright © 2013 - 2026 Tencent Cloud. All Rights Reserved. 腾讯云 版权所有
深圳市腾讯计算机系统有限公司 ICP备案/许可证号:粤B2-20090059 ![]() 粤公网安备44030502008569号
粤公网安备44030502008569号
腾讯云计算(北京)有限责任公司 京ICP证150476号 | 京ICP备11018762号