
如何在Graphviz/dot/neato中创建命名的边缘“类型”?
我需要用graphviz/dot绘制一个图,其中节点之间有共同的边缘类型,我试图找到一种方法为每种边缘类型定义一个标签,然后在图中多次使用该标签。
例如,想象一下传统的吊扇FSM示例,它最初处于关闭状态,每当有人拉下电源线时,它就会根据风扇的速度改变为一个新的状态:
     Pull         Pull        Pull
OFF ------> HIGH ------> MED ------> LOW
 ^                                    |
 |                Pull                |
 +------------------------------------+
每一条边都被命名为“拉”,我可以用点来定义它,方法是:
digraph fan {
    OFF  -> HIGH [label="Pull"];
    HIGH -> MED  [label="Pull"];
    MED  -> LOW  [label="Pull"];
    LOW  -> OFF  [label="Pull"];
}
但我不想每次都指定相同的文本标签,因为
- 我的标签很长,所以很容易出错,而且
- 除了标签之外,我的边缘还有其他属性,比如颜色,以及
- 我选择了多种不同类型的边缘,因此我希望确保在图表中不同上下文中使用的边缘类型"A“总是具有所有相同的属性。
我希望点有一个语法,可以为我的边缘类型定义名称,如下所示:
digraph fan {
    edge_a [label="Pull"];

    OFF  -> HIGH edge_a;
    HIGH -> MED  edge_a;
    MED  -> LOW  edge_a;
    LOW  -> OFF  edge_a;
}
当然,真正要做的是创建一个名为“拉”的节点和未标记的边。
我在网上搜索了几个小时,但没有成功。谁知道如何预先定义边缘类型,以便在多个位置使用?
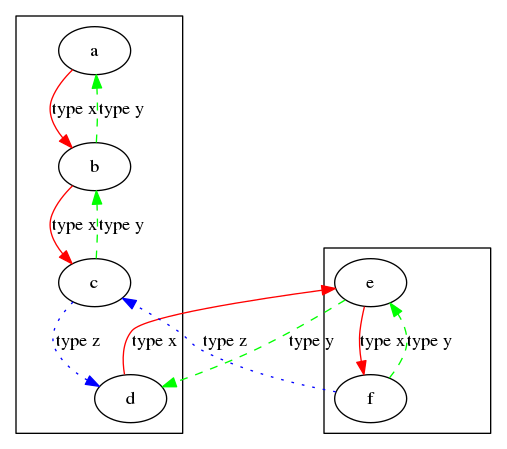
更新:定义边缘类型的 @vaettchen建议,然后列出该边缘类型的所有转换,然后定义下一个边缘类型,然后定义它的转换。虽然这在技术上可以解决我的问题,但它会引入一些其他的问题,因为我今天的图表看起来如下:
digraph {
    subgraph cluster_1 {
        a -> b [label="type x", color=red, style=solid];
        b -> a [label="type y", color=green, style=dashed];

        b -> c [label="type x", color=red, style=solid];
        c -> b [label="type y", color=green, style=dashed];

        c -> d [label="type z", color=blue, style=dotted];
    }

    subgraph cluster_2 {
        d -> e [label="type x", color=red, style=solid];
        e -> d [label="type y", color=green, style=dashed];

        e -> f [label="type x", color=red, style=solid];
        f -> e [label="type y", color=green, style=dashed];

        f -> c [label="type z", color=blue, style=dotted];
    }
}
为了重新排列,通过边缘类型,我将失去在代码中的直接视觉清晰度,使双向边彼此相邻(a->b和b->a),我必须显式列出每个子图中的节点,并且我必须将子图-内部边缘定义向上拉到主图中:
digraph {
    edge [label="type x", color=red, style=solid];
    a -> b;
    b -> c;
    d -> e;
    e -> f;

    edge [label="type y", color=green, style=dashed];
    b -> a;
    c -> b;
    e -> d;
    f -> e;

    edge [label="type z", color=blue, style=dotted];
    c -> d;
    f -> c;

    subgraph cluster_1 {
        a; b; c;
    }

    subgraph cluster_2 {
        d; e; f;
    }
}
所以,虽然它可以解决我问到的问题,我也很欣赏这个建议,但我不确定这是否值得,因为你最终得到了相当于一个C程序的结果,你必须定义函数之外的所有变量,并根据它们的类型而不是逻辑关联来组织它们。
首先,考虑到上面的示例,如果存在这样一个"edge_type“定义关键字,那么我真正希望看到的如下所示:
digraph {
    edge_type edge_x [label="type x", color=red, style=solid];
    edge_type edge_y [label="type y", color=green, style=dashed];
    edge_type edge_z [label="type z", color=blue, style=dotted];

    subgraph cluster_1 {
        a -> b edge_x;
        b -> a edge_y;

        b -> c edge_x;
        c -> b edge_y;

        c -> d edge_z;
    }

    subgraph cluster_2 {
        d -> e edge_x;
        e -> d edge_y;

        e -> f edge_x;
        f -> e edge_y;

        f -> c edge_z;
    }
}回答 3
Stack Overflow用户
发布于 2017-10-06 09:39:21
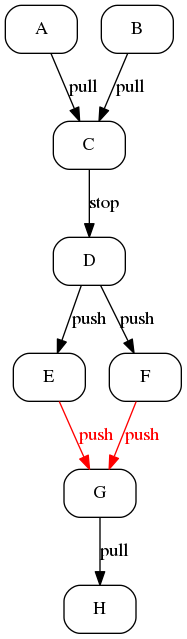
不是真正的答案,而是“思考的食物”,因为我认为在graphviz中不存在命名标签:您可以为以下边缘定义默认标签。如果您的工作流程允许在一个地方定义边缘,这将很好地工作。示例:
digraph rs
{
    node[ shape = box, style = rounded]

    edge[ label = "pull" ];
    { A B } -> C;
    G -> H;
    C -> D[ label = "stop" ];
    edge[ label = "push"];
    D -> { E F };
    edge[ color = red, fontcolor = red ];
    { E F } -> G;
}
产额
我也尝试过用
digraph fan
{
    splines = ortho;
    node [ shape=box ]

    edge [ xlabel = "Pull", minlen = 4 ];
    { rank = same; OFF  -> HIGH -> LOW; }
    LOW:s -> OFF:s;
}
产
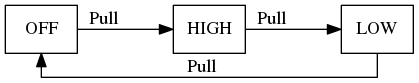
因此,它看起来不错,但所有的调整都很难扩大。
Stack Overflow用户
发布于 2017-10-22 09:29:10
我想我已经得到了您的解决方案,使用了m4 (感谢西蒙)。使用并修改示例,我创建了一个名为gv.m4的文件
digraph {
    define(`edge_x',`[label="type x", color=red, style=solid]')
    define(`edge_y',`[label="type y", color=green, style=dashed]')
    define(`edge_z',`[label="type z", color=blue, style=dotted]')

    subgraph cluster_1 {
        a -> b edge_x;
        b -> a edge_y;

        b -> c edge_x;
        c -> b edge_y;

        c -> d edge_z;
    }

    subgraph cluster_2 {
        d -> e edge_x;
        e -> d edge_y;

        e -> f edge_x;
        f -> e edge_y;

        f -> c edge_z;
    }
}
并使用简单的命令将其转换为
m4 gv.m4 > gv.dot,它现在包含您定义的边。
digraph {
subgraph cluster_1 {
a -> b [label="type x", color=red, style=solid];
b -> a [label="type y", color=green, style=dashed];
b -> c [label="type x", color=red, style=solid];
c -> b [label="type y", color=green, style=dashed];
c -> d [label="type z", color=blue, style=dotted];
}
subgraph cluster_2 {
d -> e [label="type x", color=red, style=solid];
e -> d [label="type y", color=green, style=dashed];
e -> f [label="type x", color=red, style=solid];
f -> e [label="type y", color=green, style=dashed];
f -> c [label="type z", color=blue, style=dotted];
}
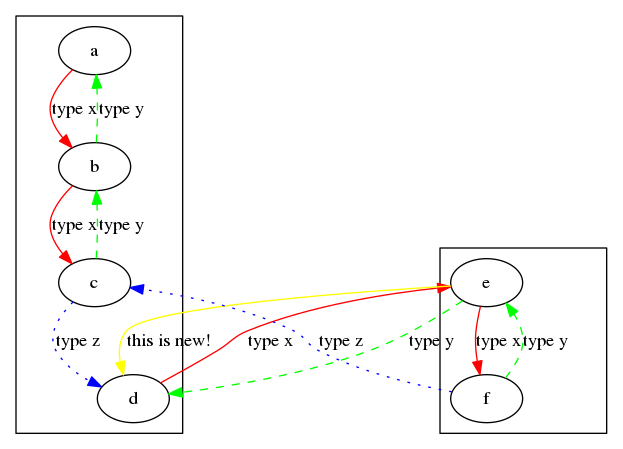
}并生成预期的图表:
您可以使用m4做更多的事情-- graphViz中缺少的东西,比如维护和(甚至有条件地)包括子文件。例如,如果将两个子图放入两个单独的文件gv1.txt和gv2.txt中,这将很好地工作:
digraph incl
{
    define(`edge_x',`[label="type x", color=red, style=solid]')
    define(`edge_y',`[label="type y", color=green, style=dashed]')
    define(`edge_z',`[label="type z", color=blue, style=dotted]')
    include(gv1.txt)
    include(gv2.txt)
     e -> d[ color = yellow, label = "this is new!"];
}
Stack Overflow用户
发布于 2021-11-18 16:54:12
我很难在我的机器上下载m4,因此选择了通过python使用graphviz,在这里您可以将样式定义为字典,并按需要应用于节点/边缘。
import graphviz

dot = graphviz.Digraph(comment='Test File')


nodeAttr_statement = dot.node_attr = {"shape": 'box', "style": 'filled', "fillcolor":"red"}
nodeAttr_question = dot.node_attr = {"shape": 'diamond', "style": 'filled', "fillcolor":"blue"}

dot.edge_attr

edge_Attr_sample = dot.edge_attr = {"arrowhead":'vee',"color":"yellow"}
edge_Attr_sample2 = dot.edge_attr = {"arrowhead": 'diamond', "color": "green"}


dot.node("A", "A", nodeAttr_statement)
dot.node("B", "B", nodeAttr_question )


dot.edge("A", "B", _attributes=edge_Attr_sample)
dot.edge("B", "A", _attributes=edge_Attr_sample2)
dot.format = 'pdf'
dot.render('test', view=True)
输出
// Test File
digraph {
    node [fillcolor=blue shape=diamond style=filled]
    edge [arrowhead=diamond color=green]
    A [label=A fillcolor=red shape=box style=filled]
    B [label=B fillcolor=blue shape=diamond style=filled]
    A -> B [arrowhead=vee color=yellow]
    B -> A [arrowhead=diamond color=green]
}
https://stackoverflow.com/questions/46595101
复制相似问题
腾讯云开发者

Copyright © 2013 - 2026 Tencent Cloud. All Rights Reserved. 腾讯云 版权所有
深圳市腾讯计算机系统有限公司 ICP备案/许可证号:粤B2-20090059 ![]() 粤公网安备44030502008569号
粤公网安备44030502008569号
腾讯云计算(北京)有限责任公司 京ICP证150476号 | 京ICP备11018762号