
纵横条形图中的条形图顺序
纵横条形图中的条形图顺序
提问于 2017-10-05 04:58:11
prettyplotlib 如何控制条形图中条形图的顺序?
来自prettyplotlib==0.1.7
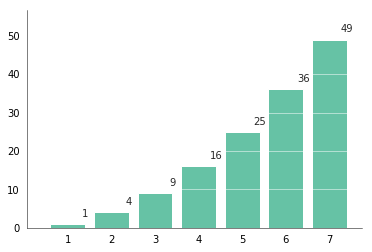
使用标准的ppl.bar,我可以得到这样的条形图:
%matplotlib inline
import numpy as np
import prettyplotlib as ppl
import matplotlib.pyplot as plt

fig, ax = plt.subplots(1)

counter = {1:1, 2:4, 3:9, 4:16, 5:25, 6:36, 7:49}

x, y = zip(*counter.items())

ppl.bar(ax, x , y, annotate=True, grid='y')
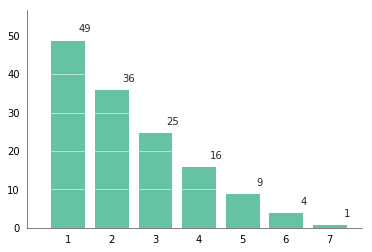
但是,如果我想反转x轴条,当我更改x列表时,条形图的顺序颠倒了,而不是标签:
ppl.bar(ax, list(reversed(x)) , y, annotate=True, grid='y')

我可以使用xticklabels参数:
ppl.bar(ax, list(reversed(x)) , y, annotate=True, xticklabels=list('7654321'), grid='y')但这也不起作用,它返回相同的条形顺序,错误的x轴标签:
奇怪的是,当我逆转xticklabels的列表时,
ppl.bar(ax, list(reversed(x)) , y, annotate=True, xticklabels=list('1234567'), grid='y')我已经得到了我所需要的,但奇怪的是,现在x列表被颠倒了,但xticklabels却没有.

但是,如果我删除了x列表中相反的内容:
ppl.bar(ax, x , y, annotate=True, xticklabels=list('1234567'), grid='y')我们得到了第一个和ppl.bar(ax, x , y, annotate=True, grid='y')相同的图.

回答 1
Stack Overflow用户
回答已采纳
发布于 2017-10-05 08:41:07
由于prettyplotlib主要负责样式,所以您的问题实际上并不局限于它的使用,您需要使用本机matplotlib方法来反转x轴:
import numpy as np
import prettyplotlib as ppl
import matplotlib.pyplot as plt

fig, ax = plt.subplots(1)

counter = {1:1, 2:4, 3:9, 4:16, 5:25, 6:36, 7:49}

x, y = zip(*counter.items())

ppl.bar(ax, x , y, annotate=True, grid='y')
ax.invert_xaxis() # <-- fix
结果正是您所需要的:无论是情节还是标签都是颠倒的:
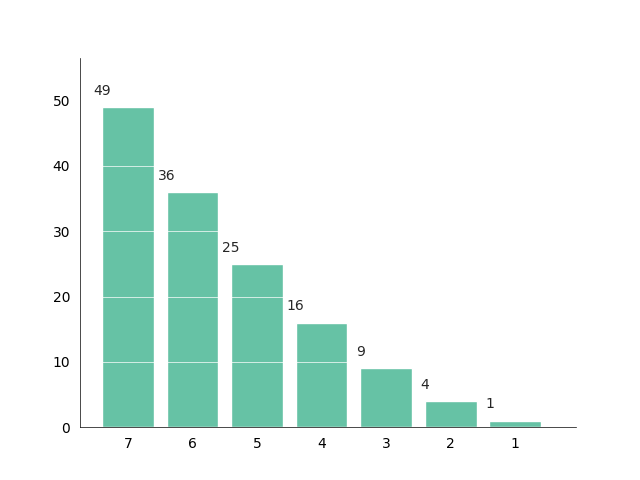
这也是解决问题的语义正确的方法:您的数据仍然是相同的,您只希望它以不同的方式表示。
页面原文内容由Stack Overflow提供。腾讯云小微IT领域专用引擎提供翻译支持
原文链接:
https://stackoverflow.com/questions/46578130
复制相关文章
相似问题
腾讯云开发者

Copyright © 2013 - 2026 Tencent Cloud. All Rights Reserved. 腾讯云 版权所有
深圳市腾讯计算机系统有限公司 ICP备案/许可证号:粤B2-20090059 ![]() 粤公网安备44030502008569号
粤公网安备44030502008569号
腾讯云计算(北京)有限责任公司 京ICP证150476号 | 京ICP备11018762号