
具有xticks与xticks同步的多个地块
具有xticks与xticks同步的多个地块
提问于 2017-10-04 12:19:45
我想知道是否有可能以这种方式将xticks与xticks同步:
x = [0,1,2,3,4,5,6,7,8,9,10,11,12,13,14,15,16,17,18,19,20]

XLabels = ['A','B','C','D','E','F','G','H','I','J','K','L','M','N','O','P','Q','R','S','T','U']
现在在屏幕0 5 10 15 20,但在第二次情节,有A,B,C,D,E。
我想看看:A,F,K,P,U。
    import matplotlib.pyplot as plt
    from matplotlib.ticker import ScalarFormatter, FormatStrFormatter, MultipleLocator   # format X scale
    import numpy as np
    x=[0,1,2,3,4,5,6,7,8,9,10,11,12,13,14,15,16,17,18,19,20]
    fig = plt.figure()
    ax1 = fig.add_subplot(2,1,1)
    ax1.plot((np.arange(min(x), max(x)+1, 1.0)), 'b-')
    ax2 = fig.add_subplot(2,1,2)  # , sharex=ax1)
    ax2.plot((np.arange(min(x), max(x)+1, 1.0)), 'r-')
    #plt.setp(ax1.get_xticklabels(), visible=False)
    ax2.xaxis.set_major_formatter(FormatStrFormatter('%0d'))
    ax2.set_xticklabels(['A','B','C','D','E','F','G','H','I','J','K','L','M','N','O','P','Q','R','S','T','U'], fontsize=12)
    plt.show()
怎样才能同步,使我的A F K P U对应于0 5 10 15 20?
回答 2
Stack Overflow用户
回答已采纳
发布于 2017-10-04 13:02:23
最简单的选择是手动设置滴答和滴答标签。例如,如果您想要勾选每个N第四个整数,您可以选择列表的一个子集([::N])来将滴答和标签设置为。
import matplotlib.pyplot as plt
import numpy as np

x = [0,1,2,3,4,5,6,7,8,9,10,11,12,13,14,15,16,17,18,19,20]
XLabels = ['A','B','C','D','E','F','G','H','I','J','K','L','M','N','O','P','Q',
           'R','S','T','U']

N = 5

fig = plt.figure()
ax1 = fig.add_subplot(2,1,1)
ax1.plot((np.arange(min(x), max(x)+1, 1.0)), 'b-')
ax1.set_xticks(x[::N])

ax2 = fig.add_subplot(2,1,2)  # , sharex=ax1)
ax2.plot((np.arange(min(x), max(x)+1, 1.0)), 'r-')

ax2.set_xticks(x[::N])
ax2.set_xticklabels(XLabels[::N], fontsize=12)

plt.show()为了实现这种自动化,您可以使用一个FuncFormatter,它根据勾号的位置从XLabels列表中选择正确的字母。
import matplotlib.pyplot as plt
from matplotlib.ticker import ScalarFormatter, FuncFormatter, MultipleLocator
import numpy as np

x = [0,1,2,3,4,5,6,7,8,9,10,11,12,13,14,15,16,17,18,19,20]
XLabels = ['A','B','C','D','E','F','G','H','I','J','K','L','M','N','O','P','Q',
           'R','S','T','U']

N = 5

fig = plt.figure()
ax1 = fig.add_subplot(2,1,1)
ax1.plot((np.arange(min(x), max(x)+1, 1.0)), 'b-')
ax1.xaxis.set_major_locator(MultipleLocator(N))

ax2 = fig.add_subplot(2,1,2)  # , sharex=ax1)
ax2.plot((np.arange(min(x), max(x)+1, 1.0)), 'r-')

def f(c,pos):
    if int(c) in x:
        d = dict(zip(x,XLabels))
        return d[int(c)]
    else:
        return ""

ax2.xaxis.set_major_locator(MultipleLocator(N))
ax2.xaxis.set_major_formatter(FuncFormatter(f))

plt.show()Stack Overflow用户
发布于 2017-10-04 12:59:54
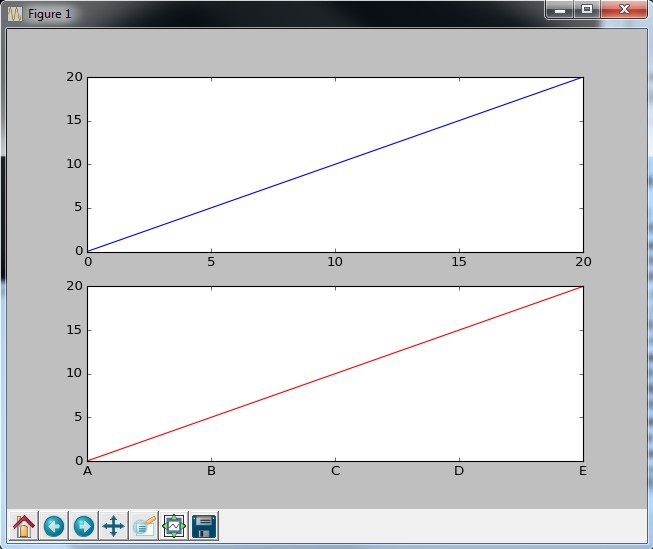
您可以筛选标签列表以获得与x轴匹配的标签,并使用set_xticks和set_xticklabels。
一个简化的例子:
import matplotlib.pyplot as plt

x = [0, 5, 10, 15, 20]
labels = ['A','B','C','D','E','F','G','H','I','J','K','L','M','N','O','P','Q','R','S','T','U']

fig = plt.figure()
ax1 = fig.add_subplot(2,1,1)
ax1.plot(x, x, 'b-')

ax2 = fig.add_subplot(2,1,2)
ax2.plot(x, x, 'r-')
ax2.set_xticks(x)
ax2.set_xticklabels([label for index, label in enumerate(labels) if index in x])

plt.show()页面原文内容由Stack Overflow提供。腾讯云小微IT领域专用引擎提供翻译支持
原文链接:
https://stackoverflow.com/questions/46564727
复制相关文章
相似问题
腾讯云开发者

Copyright © 2013 - 2026 Tencent Cloud. All Rights Reserved. 腾讯云 版权所有
深圳市腾讯计算机系统有限公司 ICP备案/许可证号:粤B2-20090059 ![]() 粤公网安备44030502008569号
粤公网安备44030502008569号
腾讯云计算(北京)有限责任公司 京ICP证150476号 | 京ICP备11018762号