
调用curve_fit时匹配任意数量的参数
我发现最接近这个问题的是这里:Fitting only one parameter of a function with many parameters in python。我有一个多参数函数,我希望能够调用它,在代码的不同部分优化不同的参数子集(因为对于某些数据集,我可能能够根据辅助数据修复一些参数)。以下问题的简化演示。
from scipy.optimize import curve_fit
import numpy as np

def wrapper_func(**kwargs):
    a = kwargs['a'] if 'a' in kwargs else None
    b = kwargs['b'] if 'b' in kwargs else None
    c = kwargs['c'] if 'c' in kwargs else None
return lambda x, a, c: func(x, a, b, c)

def func(x, a, b, c):
    return a * x**2 + b * x + c

# Set parameters
a = 0.3
b = 5
c = 17

# Make some fake data
x_vals = np.arange(100)
y_vals = a * x_vals**2 + b * x_vals + c
noise = np.random.randn(100) * 20

# Get fit
popt, pcov = curve_fit(lambda x, a_, c_: func(x, a_, b, c_),
                       x_vals, y_vals + noise)

# Get fit using separate function
alt_popt, alt_cov = curve_fit(wrapper_func(b=5), x_vals, y_vals + noise)
因此,这是可行的,但我希望能够传递任何组合的参数,以得到固定。在这里,参数a和c是优化的,b是固定的,但是如果我想修复a和优化b和c(或任何其他组合),那么有什么方法可以做到这一点呢?我从上面的wrapper_func()开始,但也出现了同样的问题:除了编写多个lambda(取决于传递了哪些固定的参数值)之外,似乎无法更改优化的参数。这很快就变得丑陋了,因为我正在处理的方程式有4-6个参数。我可以让一个版本使用eval,但收集这是不推荐的。就目前情况而言,我一直在尝试在lambda中使用*args,但没有设法让它工作。任何小贴士都非常感谢!
回答 2
Stack Overflow用户
发布于 2017-10-05 00:18:57
lmfit (https://lmfit.github.io/lmfit-py/)正是这样做的。不是为fit中的参数创建一个浮点值数组,而是创建一个参数对象--一个参数对象的有序字典,用于为数据参数化模型。每个参数可以是固定的,也可以是可变的,可以有最大值/分界,也可以用拟合中的其他参数定义为一个简单的数学表达式。
也就是说,有了lmfit (以及它的模型类,对于曲线拟合特别有用),我们就可以创建参数,然后决定哪些是优化的,哪些是固定的。
举个例子,下面是您所提出的问题的一个变化:
import numpy as np
from lmfit import Model
import matplotlib.pylab as plt

# starting parameters
a, b, c = 0.3, 5, 17
x_vals = np.arange(100)
noise = np.random.normal(size=100, scale=0.25)
y_vals = a * x_vals**2 + b * x_vals + c + noise

def func(x, a, b, c):
    return a * x**2 + b * x + c

# create a Model from this function
model = Model(func)

# create parameters with initial values. Model will know to
# turn function args `a`, `b`, and `c` into Parameters:
params = model.make_params(a=0.25, b=4, c=10)

# you can alter each parameter, for example, fix b or put bounds on a
params['b'].vary = False
params['b'].value = 5.3
params['a'].min = -1
params['a'].max =  1

# run fit
result = model.fit(y_vals, params, x=x_vals)

# print and plot results
print(result.fit_report())
result.plot(datafmt='--')
plt.show()
将打印出来:
[[Model]]
    Model(func)
[[Fit Statistics]]
    # function evals   = 12
    # data points      = 100
    # variables        = 2
    chi-square         = 475.843
    reduced chi-square = 4.856
    Akaike info crit   = 159.992
    Bayesian info crit = 165.202
[[Variables]]
    a:   0.29716481 +/- 7.46e-05 (0.03%) (init= 0.25)
    b:   5.3 (fixed)
    c:   11.4708897 +/- 0.329508 (2.87%) (init= 10)
[[Correlations]] (unreported correlations are <  0.100)
C(a, c) = -0.744 (您会发现b和c是高度负相关的),并显示了一个类似于
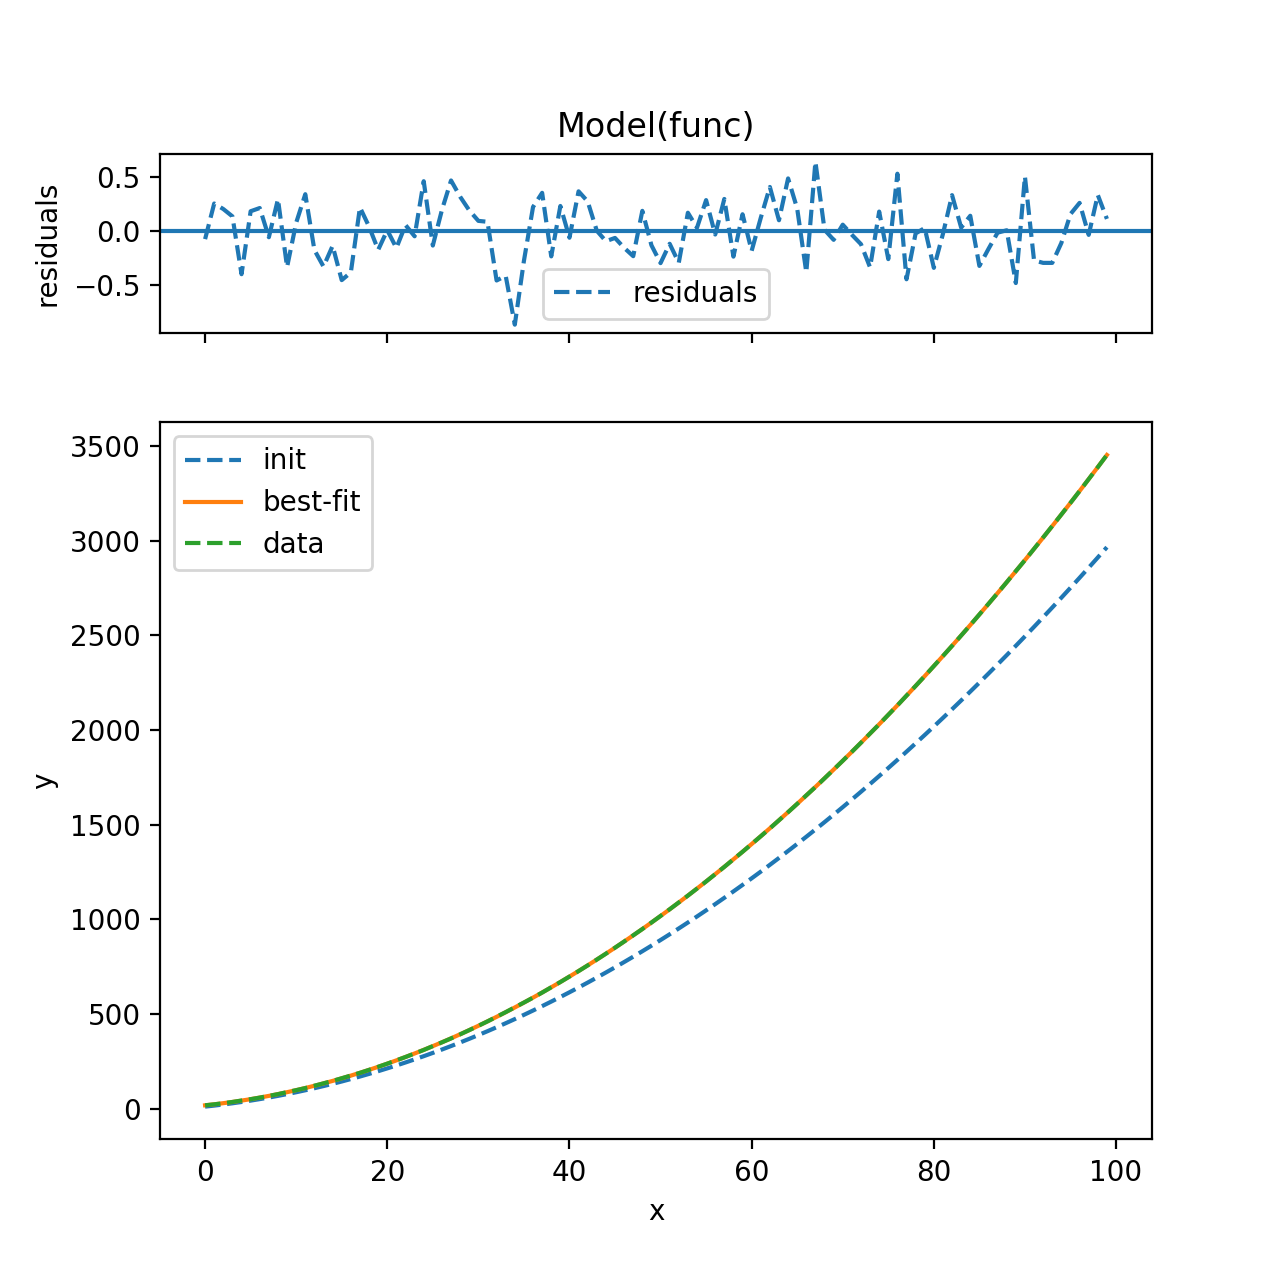
此外,fit结果(包括参数)保存在result中,因此,如果要更改固定的参数,只需更改起始值(fit尚未更新):
params['b'].vary = True
params['a'].value = 0.285
params['a'].vary = False

newresult = model.fit(y_vals, params, x=x_vals)
然后比较/对比这两个结果。
Stack Overflow用户
发布于 2017-10-04 09:43:16
这是我的解决方案。我不知道如何使用curve_fit,但它与leastsq一起工作。它有一个包装器函数,它接受自由和固定的参数以及自由参数位置的列表。由于leastsq首先用空闲参数调用函数,因此包装器必须重新排列顺序。
from matplotlib import pyplot as plt
import numpy as np
from scipy.optimize import leastsq
def func(x,a,b,c,d,e):
return a+b*x+c*x**2+d*x**3+e*x**4
#takes x, the 5 parameters and a list
# the first n parameters are free
# the list of length n gives there position, e.g. 2 parameters, 1st and 3rd order ->[1,3]
# the remaining parameters are in order, i.e. in this example it would be f(x,b,d,a,c,e)
def expand_parameters(*args):
callArgs=args[1:6]
freeList=args[-1]
fixedList=range(5)
for item in freeList:
fixedList.remove(item)
callList=[0,0,0,0,0]
for val,pos in zip(callArgs, freeList+fixedList):
callList[pos]=val
return func(args[0],*callList)
def residuals(parameters,dataPoint,fixedParameterValues=None,freeParametersPosition=None):
if fixedParameterValues is None:
a,b,c,d,e = parameters
dist = [y -func(x,a,b,c,d,e) for x,y in dataPoint]
else:
assert len(fixedParameterValues)==5-len(freeParametersPosition)
assert len(fixedParameterValues)>0
assert len(fixedParameterValues)<5 # doesn't make sense to fix all
extraIn=list(parameters)+list(fixedParameterValues)+[freeParametersPosition]
dist = [y -expand_parameters(x,*extraIn) for x,y in dataPoint]
return dist
if __name__=="__main__":
xList=np.linspace(-1,3,15)
fList=np.fromiter( (func(s,1.1,-.9,-.7,.5,.1) for s in xList), np.float)
fig=plt.figure()
ax=fig.add_subplot(1,1,1)
dataTupel=zip(xList,fList)
###some test
print residuals([1.1,-.9,-.7,.5,.1],dataTupel)
print residuals([1.1,-.9,-.7,.5],dataTupel,fixedParameterValues=[.1],freeParametersPosition=[0,1,2,3])
#exact fit
bestFitValuesAll, ier = leastsq(residuals, [1,1,1,1,1],args=(dataTupel))
print bestFitValuesAll
###Only a constant
guess=[1]
bestFitValuesConstOnly, ier = leastsq(residuals, guess,args=(dataTupel,[0,0,0,0],[0]))
print bestFitValuesConstOnly
fConstList=np.fromiter(( func(x,*np.append(bestFitValuesConstOnly,[0,0,0,0])) for x in xList),np.float)
###Only 2nd and 4th
guess=[1,1]
bestFitValues_1_3, ier = leastsq(residuals, guess,args=(dataTupel,[0,0,0],[2,4]))
print bestFitValues_1_3
f_1_3_List=np.fromiter(( expand_parameters(x, *(list(bestFitValues_1_3)+[0,0,0]+[[2,4]] ) ) for x in xList),np.float)
###Only 2nd and 4th with closer values
guess=[1,1]
bestFitValues_1_3_closer, ier = leastsq(residuals, guess,args=(dataTupel,[1.2,-.8,0],[2,4]))
print bestFitValues_1_3_closer
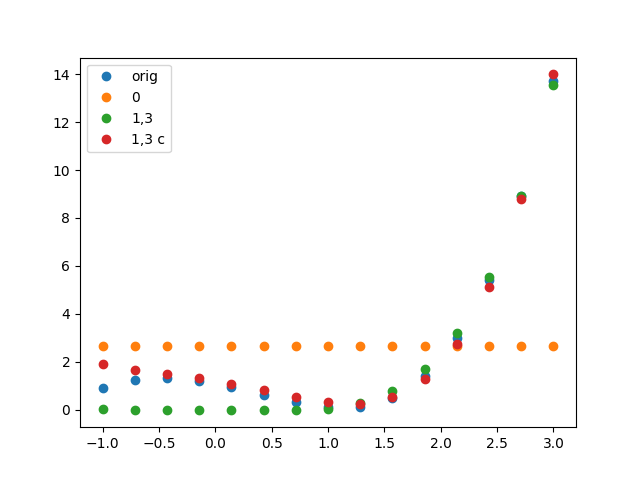
f_1_3_closer_List=np.fromiter(( expand_parameters(x, *(list(bestFitValues_1_3_closer)+[1.2,-.8,0]+[[2,4]] ) ) for x in xList),np.float)
ax.plot(xList,fList,linestyle='',marker='o',label='orig')
ax.plot(xList,fConstList,linestyle='',marker='o',label='0')
ax.plot(xList,f_1_3_List,linestyle='',marker='o',label='1,3')
ax.plot(xList,f_1_3_closer_List,linestyle='',marker='o',label='1,3 c')
ax.legend(loc=0)
plt.show()提供:
>>[0.0, 0.0, 0.0, 0.0, 0.0, 0.0, 0.0, 0.0, 0.0, 0.0, 0.0, 0.0, 0.0, 0.0, 0.0]
>>[0.0, 0.0, 0.0, 0.0, 0.0, 0.0, 0.0, 0.0, 0.0, 0.0, 0.0, 0.0, 0.0, 0.0, 0.0]
>>[ 1.1 -0.9 -0.7  0.5  0.1]
>>[ 2.64880466]
>>[-0.14065838  0.18305123]
>>[-0.31708629  0.2227272 ]
https://stackoverflow.com/questions/46557529
复制相似问题
腾讯云开发者

Copyright © 2013 - 2026 Tencent Cloud. All Rights Reserved. 腾讯云 版权所有
深圳市腾讯计算机系统有限公司 ICP备案/许可证号:粤B2-20090059 ![]() 粤公网安备44030502008569号
粤公网安备44030502008569号
腾讯云计算(北京)有限责任公司 京ICP证150476号 | 京ICP备11018762号