
熊猫"TypeError:不支持的操作数类型(S)表示+:'Timedelta‘和’浮‘“
熊猫"TypeError:不支持的操作数类型(S)表示+:'Timedelta‘和’浮‘“
提问于 2017-10-02 15:19:11
我正在尝试使用带有sql结果填充的数据框架的autocorrelation_plot()函数,但是在运行以下代码时,我仍然会得到这个错误:
import MySQLdb
import pandas as pd
from matplotlib import pyplot
from pandas.tools.plotting import autocorrelation_plot
connection = MySQLdb.connect(host = "host", user = "user", passwd = "passwd", db = "db")
exect = connection.cursor()
query = "query"
exect.execute(query)
frame = pd.read_sql(query, con=connection)
connection.close()
print(frame.head())
autocorrelation_plot(frame)
pyplot.show()
我可以在没有问题的情况下打印框架,但是当我尝试使用autocorrelation_plot()函数时,我会得到这个错误。我的数据框架的输出如下:
time      value
0 00:00:14  283.80
1 00:01:14  271.97
2 00:02:14  320.53
3 00:03:14  346.78
4 00:04:14  280.72
5 00:05:14  277.41
6 00:06:14  308.65
7 00:07:14  321.27
8 00:08:14  320.68
9 00:09:14 332.32回答 1
Stack Overflow用户
回答已采纳
发布于 2017-10-02 15:51:12
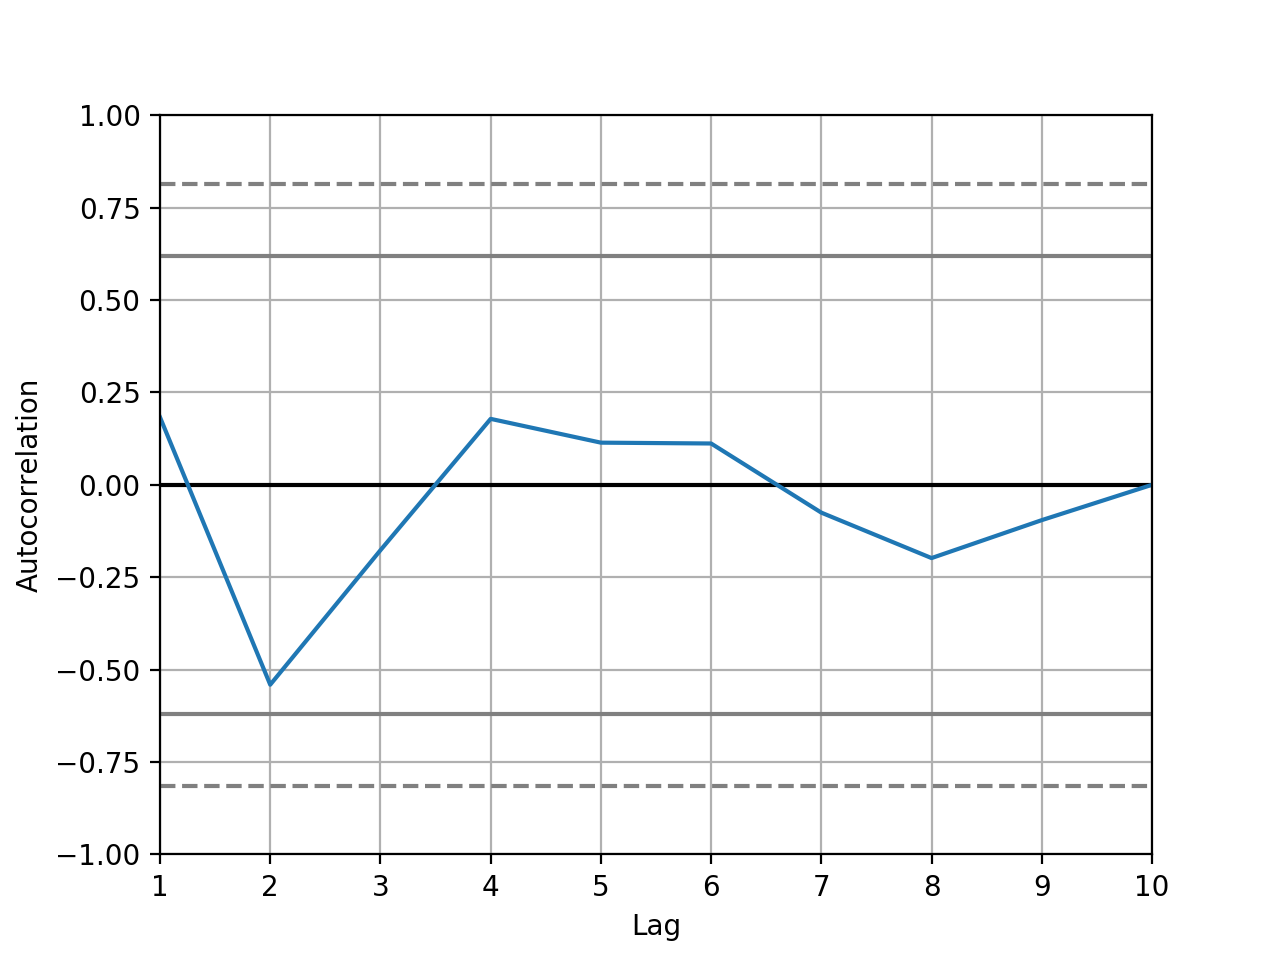
在绘图之前,使用set_index将time设置为索引可能会有好处。
from pandas.plotting import autocorrelation_plot

df
      time   value
0 00:00:14  283.80
1 00:01:14  271.97
2 00:02:14  320.53
3 00:03:14  346.78
4 00:04:14  280.72
5 00:05:14  277.41
6 00:06:14  308.65
7 00:07:14  321.27
8 00:08:14  320.68
9 00:09:14  332.32

df.dtypes
time     timedelta64[ns]
value            float64
dtype: object

autocorrelation_plot(df.set_index('time'))
plt.show()
页面原文内容由Stack Overflow提供。腾讯云小微IT领域专用引擎提供翻译支持
原文链接:
https://stackoverflow.com/questions/46528520
复制相关文章
相似问题
腾讯云开发者

Copyright © 2013 - 2026 Tencent Cloud. All Rights Reserved. 腾讯云 版权所有
深圳市腾讯计算机系统有限公司 ICP备案/许可证号:粤B2-20090059 ![]() 粤公网安备44030502008569号
粤公网安备44030502008569号
腾讯云计算(北京)有限责任公司 京ICP证150476号 | 京ICP备11018762号