
使用rvest抓取HTML data.table
使用rvest抓取HTML data.table
提问于 2017-10-01 22:23:26
我正在尝试使用R rvest包从明尼苏达DNR中抓取“鱼肉样本”表数据。我使用chrome扩展SelectorGadget来查找表的xpath。我无法从网页中获取任何表格数据到R.非常感谢您的帮助。
library(rvest)

urllakes<- read_html("http://www.dnr.state.mn.us/lakefind/showreport.html?
downum=27011700")

lakesnodes <- html_nodes(urllakes,xpath = '//*[(@id = "lake-survey")]')

html_table(lakesnodes,fill=TRUE) #Error: html_name(x) == "table" is not TRUE
html_text(lakesnodes) # [1] "" but no data is returned 回答 1
Stack Overflow用户
回答已采纳
发布于 2017-10-01 23:33:59
启动一个新的选项卡。打开开发工具。然后,去http://www.dnr.state.mn.us/lakefind/showreport.html?downum=27011700。
转到网络选项卡。寻找这个:
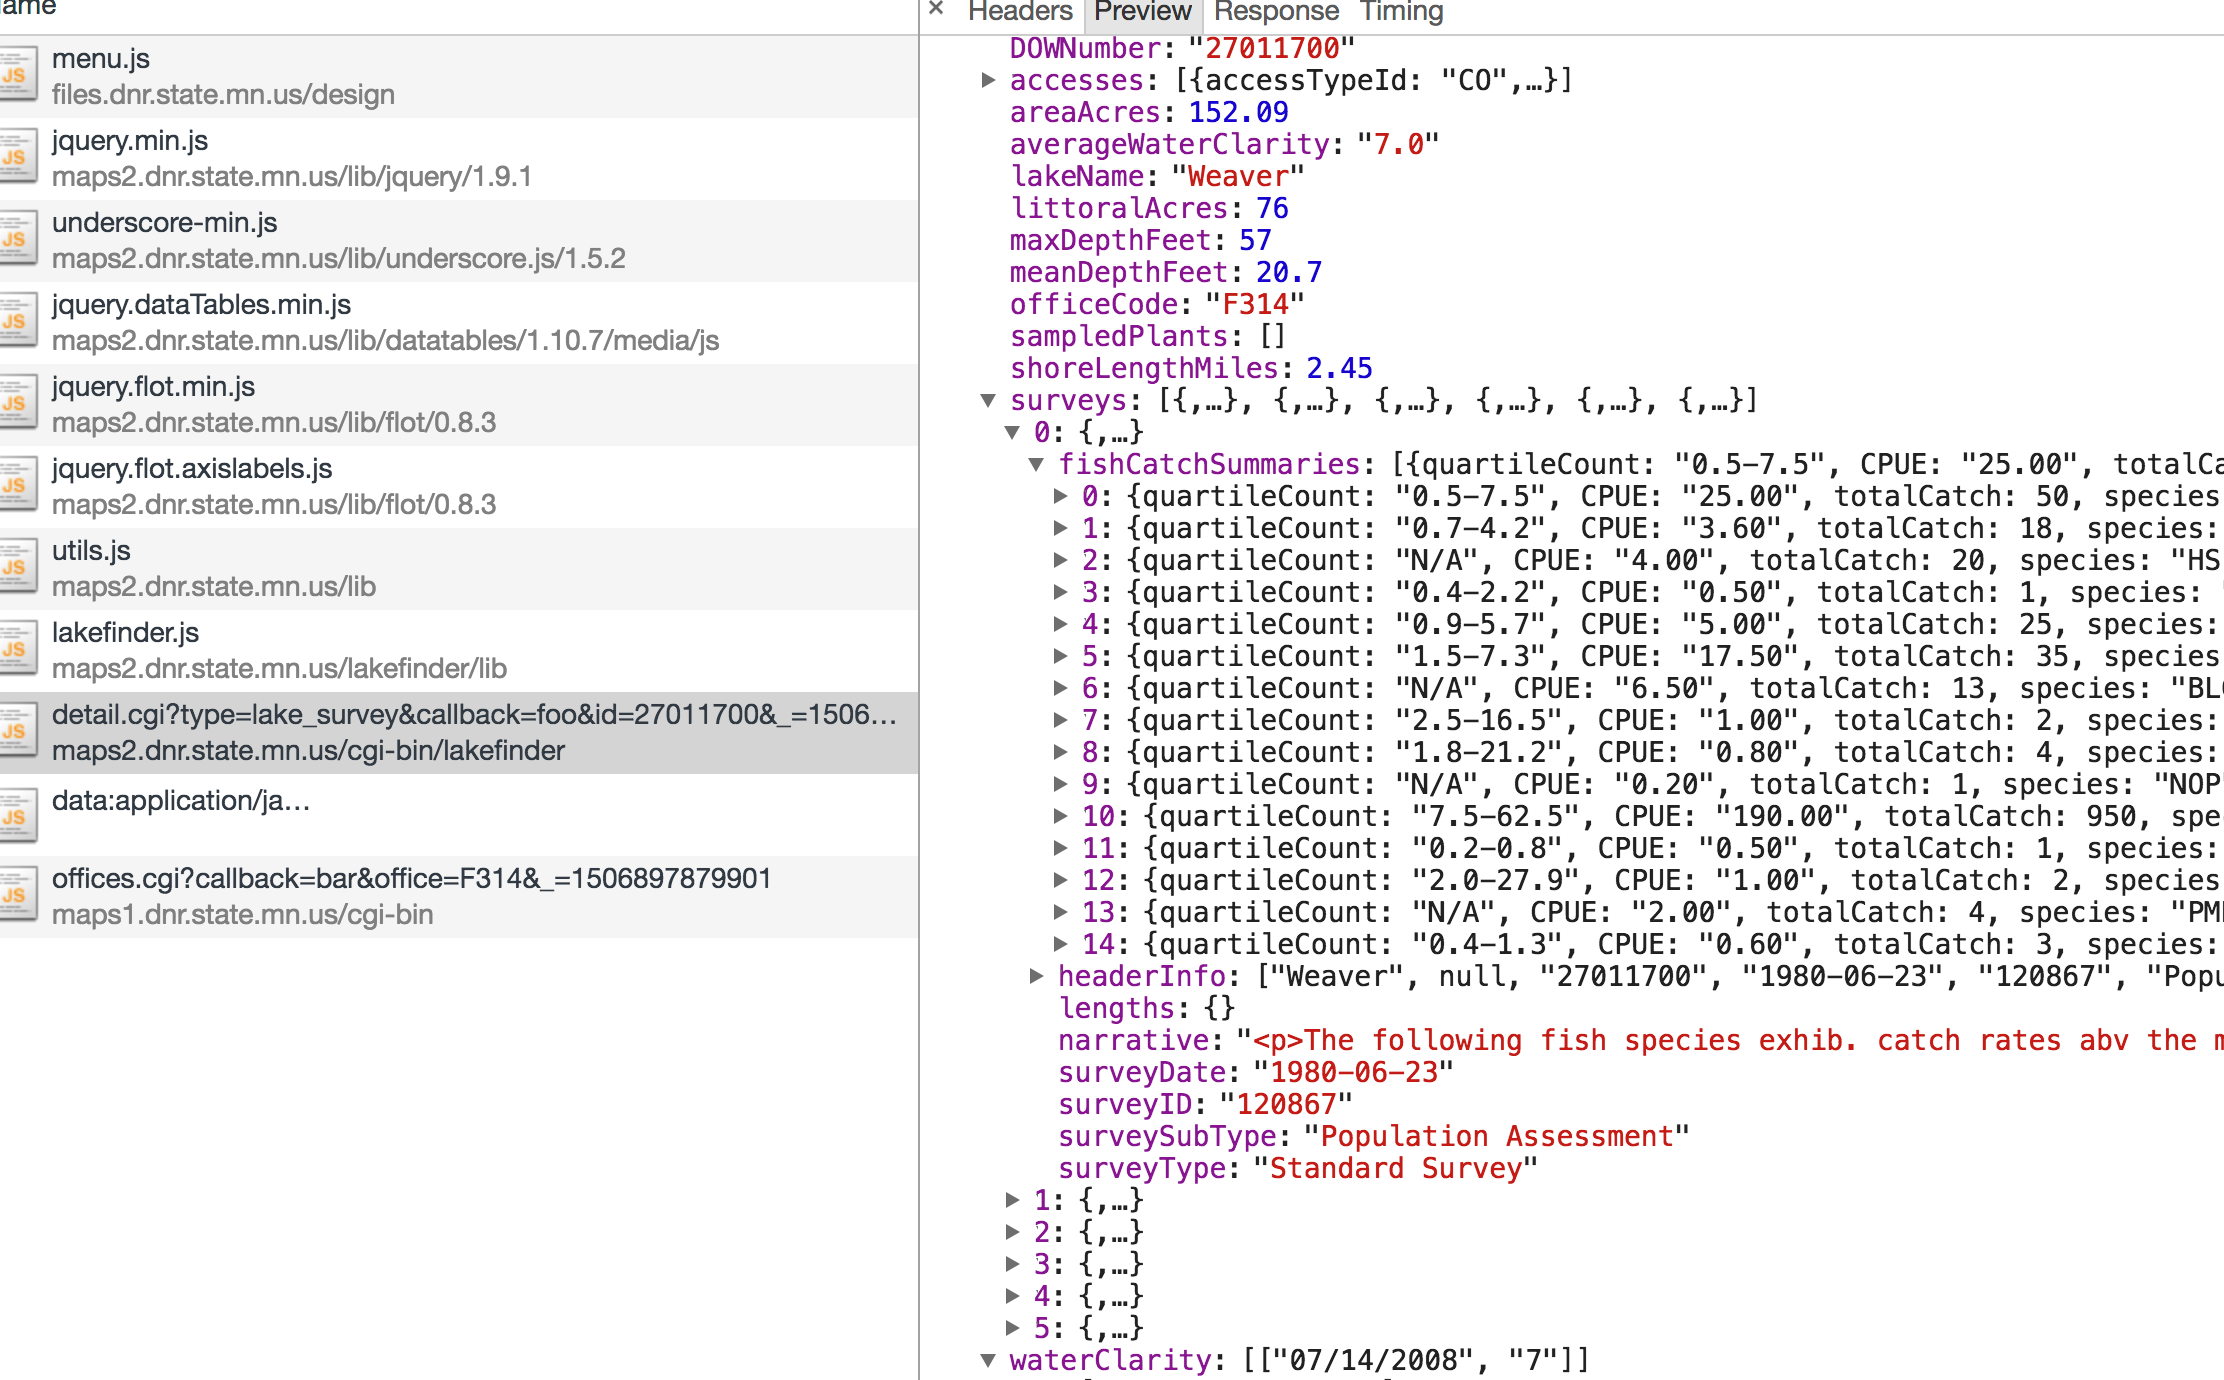
那是你的目标。使用下面的内容,您可以传入MN或URL末尾的id,然后返回数据。
library(httr)
library(jsonlite)

read_lake_survey <- function(orig_url_or_id) {

  orig_url_or_id <- orig_url_or_id[1]

  if (grepl("^htt", orig_url_or_id)) {
    tmp <- httr::parse_url(orig_url_or_id)
    if (!is.null(tmp$query$downum)) {
      orig_url_or_id <- tmp$query$downum
    } else {
      stop("Invalid URL specified", call.=FALSE)
    }
  }

  httr::GET(
    url = "http://maps2.dnr.state.mn.us/cgi-bin/lakefinder/detail.cgi",
    query = list(
      type = "lake_survey",
      callback = "",
      id = orig_url_or_id,
      `_` = as.numeric(Sys.time())
    )
  ) -> res

  httr::stop_for_status(res)

  out <- httr::content(res, as="text", encoding="UTF-8")
  out <- jsonlite::fromJSON(out, flatten=TRUE)
  out

}
就像这样:
orig_url <- "http://www.dnr.state.mn.us/lakefind/showreport.html?downum=27011700"

str(read_lake_survey(orig_url), 2)
## List of 4
##  $ timestamp: int 1506900750
##  $ status   : chr "SUCCESS"
##  $ result   :List of 13
##   ..$ averageWaterClarity: chr "7.0"
##   ..$ sampledPlants      : list()
##   ..$ officeCode         : chr "F314"
##   ..$ littoralAcres      : int 76
##   ..$ shoreLengthMiles   : num 2.45
##   ..$ areaAcres          : num 152
##   ..$ surveys            :'data.frame':  6 obs. of  52 variables:
##   ..$ accesses           :'data.frame':  1 obs. of  5 variables:
##   ..$ lakeName           : chr "Weaver"
##   ..$ DOWNumber          : chr "27011700"
##   ..$ waterClarity       : chr [1, 1:2] "07/14/2008" "7"
##   ..$ meanDepthFeet      : num 20.7
##   ..$ maxDepthFeet       : int 57
##  $ message  : chr "Normal execution."

str(read_lake_survey("27011700"), 2)
## List of 4
##  $ timestamp: int 1506900750
##  $ status   : chr "SUCCESS"
##  $ result   :List of 13
##   ..$ averageWaterClarity: chr "7.0"
##   ..$ sampledPlants      : list()
##   ..$ officeCode         : chr "F314"
##   ..$ littoralAcres      : int 76
##   ..$ shoreLengthMiles   : num 2.45
##   ..$ areaAcres          : num 152
##   ..$ surveys            :'data.frame':  6 obs. of  52 variables:
##   ..$ accesses           :'data.frame':  1 obs. of  5 variables:
##   ..$ lakeName           : chr "Weaver"
##   ..$ DOWNumber          : chr "27011700"
##   ..$ waterClarity       : chr [1, 1:2] "07/14/2008" "7"
##   ..$ meanDepthFeet      : num 20.7
##   ..$ maxDepthFeet       : int 57
##  $ message  : chr "Normal execution."

str(read_lake_survey("http://example.com"))
##  Error: Invalid URL specified
##    3. stop("Invalid URL specified", call. = FALSE)
##    2. read_lake_survey("http://example.com")
##    1. str(read_lake_survey("http://example.com"))
你可以戳它来证明它都在那里。
library(tidyverse)

# get the data into a variable
dat <- read_lake_survey(orig_url)

# focus on the surveys
surveys <- dat$result$surveys
有与页面弹出内容相匹配的"n“数据框架。
在相同的弹出窗口中,还有许多与"n“条目相关联的列表元素。我不做这种类型的分析,所以我不知道用数据框架放什么有意义。
这很可能会让你走得更远。只是在调查中加入了其他元素。
map2(surveys$fishCatchSummaries, surveys$surveyDate, ~{ .x$survey_date <- .y ; .x }) %>%
  map2(surveys$surveyType, ~{ .x$survey_type <- .y ; .x }) %>%
  map2(surveys$surveySubType, ~{ .x$survey_subtype <- .y ; .x }) %>%
  map2_df(surveys$surveyID, ~{ .$survey_id <- .y ; .x }) %>%
  as_tibble() %>%
  type_convert() %>%
  glimpse()
## Observations: 120
## Variables: 12
## $ quartileCount  <chr> "0.5-7.5", "0.7-4.2", "N/A", "0.4-2.2", "0.9-5.7", "1.5-7.3"...
## $ CPUE           <dbl> 25.0, 3.6, 4.0, 0.5, 5.0, 17.5, 6.5, 1.0, 0.8, 0.2, 190.0, 0...
## $ totalCatch     <int> 50, 18, 20, 1, 25, 35, 13, 2, 4, 1, 950, 1, 2, 4, 3, 13, 27,...
## $ species        <chr> "YEB", "PMK", "HSF", "WTS", "YEB", "NOP", "BLG", "BLC", "BLC...
## $ totalWeight    <dbl> 41.75, 2.30, 4.50, 3.50, 24.25, 146.25, 3.25, 0.60, 1.45, 2....
## $ quartileWeight <chr> "0.5-0.8", "0.1-0.2", "N/A", "1.5-2.4", "0.5-0.8", "2.0-3.5"...
## $ averageWeight  <dbl> 0.83, 0.13, 0.23, 3.50, 0.97, 4.18, 0.25, 0.30, 0.36, 2.50, ...
## $ gearCount      <int> 2, 5, 5, 2, 5, 2, 2, 2, 5, 5, 5, 2, 2, 2, 5, 2, 5, 5, 5, 2, ...
## $ gear           <chr> "Standard gill nets", "Standard trap nets", "Standard trap n...
## $ survey_date    <date> 1980-06-23, 1980-06-23, 1980-06-23, 1980-06-23, 1980-06-23,...
## $ survey_type    <chr> "Standard Survey", "Standard Survey", "Standard Survey", "St...
## $ survey_subtype <chr> "Population Assessment", "Population Assessment", "Populatio...
如果您不熟悉管道,这只是一种避免临时变量的方法。
tmp <- map2(surveys$fishCatchSummaries, surveys$surveyDate, ~{ .x$survey_date <- .y ; .x })
tmp <- map2(tmp, surveys$surveyType, ~{ .x$survey_type <- .y ; .x })
tmp <- map2(tmp, surveys$surveySubType, ~{ .x$survey_subtype <- .y ; .x })
tmp <- map2_df(tmp, surveys$surveyID, ~{ .$survey_id <- .y ; .x })
tmp <- as_tibble(tmp)
final_data <- type_convert(tmp)

glimpse(final_data)
## Observations: 120
## Variables: 12
## $ quartileCount  <chr> "0.5-7.5", "0.7-4.2", "N/A", "0.4-2.2", "0.9-5.7", "1.5-7.3"...
## $ CPUE           <dbl> 25.0, 3.6, 4.0, 0.5, 5.0, 17.5, 6.5, 1.0, 0.8, 0.2, 190.0, 0...
## $ totalCatch     <int> 50, 18, 20, 1, 25, 35, 13, 2, 4, 1, 950, 1, 2, 4, 3, 13, 27,...
## $ species        <chr> "YEB", "PMK", "HSF", "WTS", "YEB", "NOP", "BLG", "BLC", "BLC...
## $ totalWeight    <dbl> 41.75, 2.30, 4.50, 3.50, 24.25, 146.25, 3.25, 0.60, 1.45, 2....
## $ quartileWeight <chr> "0.5-0.8", "0.1-0.2", "N/A", "1.5-2.4", "0.5-0.8", "2.0-3.5"...
## $ averageWeight  <dbl> 0.83, 0.13, 0.23, 3.50, 0.97, 4.18, 0.25, 0.30, 0.36, 2.50, ...
## $ gearCount      <int> 2, 5, 5, 2, 5, 2, 2, 2, 5, 5, 5, 2, 2, 2, 5, 2, 5, 5, 5, 2, ...
## $ gear           <chr> "Standard gill nets", "Standard trap nets", "Standard trap n...
## $ survey_date    <date> 1980-06-23, 1980-06-23, 1980-06-23, 1980-06-23, 1980-06-23,...
## $ survey_type    <chr> "Standard Survey", "Standard Survey", "Standard Survey", "St...
## $ survey_subtype <chr> "Population Assessment", "Population Assessment", "Populatio...

final_data
## # A tibble: 120 x 12
##    quartileCount  CPUE totalCatch species totalWeight quartileWeight averageWeight gearCount               gear survey_date     survey_type        survey_subtype
##            <chr> <dbl>      <int>   <chr>       <dbl>          <chr>         <dbl>     <int>              <chr>      <date>           <chr>                 <chr>
##  1       0.5-7.5  25.0         50     YEB       41.75        0.5-0.8          0.83         2 Standard gill nets  1980-06-23 Standard Survey Population Assessment
##  2       0.7-4.2   3.6         18     PMK        2.30        0.1-0.2          0.13         5 Standard trap nets  1980-06-23 Standard Survey Population Assessment
##  3           N/A   4.0         20     HSF        4.50            N/A          0.23         5 Standard trap nets  1980-06-23 Standard Survey Population Assessment
##  4       0.4-2.2   0.5          1     WTS        3.50        1.5-2.4          3.50         2 Standard gill nets  1980-06-23 Standard Survey Population Assessment
##  5       0.9-5.7   5.0         25     YEB       24.25        0.5-0.8          0.97         5 Standard trap nets  1980-06-23 Standard Survey Population Assessment
##  6       1.5-7.3  17.5         35     NOP      146.25        2.0-3.5          4.18         2 Standard gill nets  1980-06-23 Standard Survey Population Assessment
##  7           N/A   6.5         13     BLG        3.25            N/A          0.25         2 Standard gill nets  1980-06-23 Standard Survey Population Assessment
##  8      2.5-16.5   1.0          2     BLC        0.60        0.1-0.3          0.30         2 Standard gill nets  1980-06-23 Standard Survey Population Assessment
##  9      1.8-21.2   0.8          4     BLC        1.45        0.2-0.3          0.36         5 Standard trap nets  1980-06-23 Standard Survey Population Assessment
## 10           N/A   0.2          1     NOP        2.50            N/A          2.50         5 Standard trap nets  1980-06-23 Standard Survey Population Assessment
## # ... with 110 more rows页面原文内容由Stack Overflow提供。腾讯云小微IT领域专用引擎提供翻译支持
原文链接:
https://stackoverflow.com/questions/46517463
复制相关文章
相似问题
腾讯云开发者

Copyright © 2013 - 2026 Tencent Cloud. All Rights Reserved. 腾讯云 版权所有
深圳市腾讯计算机系统有限公司 ICP备案/许可证号:粤B2-20090059 ![]() 粤公网安备44030502008569号
粤公网安备44030502008569号
腾讯云计算(北京)有限责任公司 京ICP证150476号 | 京ICP备11018762号