
贾斯珀报告的颜色问题与高图表的plotOptions.fillColor
我正在Jaspersoft Studio 6.4中开发一个使用自定义可视化组件和高级图表的报告。
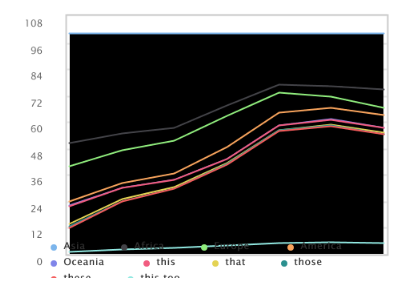
长话短说,当做泡泡图或区域图时,plotOptions.fillColor -attribute没有正常工作,而是将气泡留在内部或堆叠的区域图的内部为黑色。黑色通常意味着颜色是找不到的,但是气泡/线在区域图中的线可以正常工作。
下面是用于区域图表的以下高级图表脚本:
define(['jquery_hc','hchart'], function ($, Highcharts) {

	return function (instanceData) {

	// Creating the chart
	var config = {

    chart: {
    	type: 'area',
    	plotBorderWidth: 1,
        renderTo: instanceData.id,
        width: instanceData.width,
		height: instanceData.height,
		marginBottom: 15,
		marginLeft: 40,
		marginRight: 5,
		marginTop: 5
    },
    title: {
    	text: ""
    },
    colors: ['#927453', '#9b672c', '#b0771e', '#e66726', '#474747', '#949494', '#feb40b', '#bd9c31', '#e0b33a'],
    xAxis: {
        allowDecimals: false,
        title: {enabled: false},
        labels: {enabled: false},
        visible: false
    },
	  legend: {
	  	itemStyle: {"fontSize": 6},
	  	symbolPadding: 4,
	  	symbolHeight: 4,
        symbolWidth: 4,
        y: 20
	  },
      credits: {enabled: false},
	yAxis: {
		title: {enabled: false},
        labels: {
        	style: {"fontSize": 6},
        	formatter: function () {
         	   return this.value;
           	},
        },
        tickInterval: 2
    },
    plotOptions: {
        area: {
            stacking: 'percent',
        	animation: false,
        	marker: {
        		enabled: false
        	},
        	lineWidth: 1
        }
    },
    series: [{
        name: 'that',
        data: [502, 635, 809, 947, 1402, 3634, 5268]
    }, {
        name: 'it',
        data: [106, 107, 111, 133, 221, 767, 1766]
    }, {
        name: 'with',
        data: [163, 203, 276, 408, 547, 729, 628]
    }, {
        name: 'who',
        data: [18, 31, 54, 156, 339, 818, 1201]
    }, {
        name: 'how',
        data: [2, 2, 2, 6, 13, 30, 46]
    }, {
        name: 'this',
        data: [82, 72, 62, 46, 113, 320, 443]
    }, {
        name: 'that',
        data: [11, 12, 14, 16, 13, 55, 113]
    }, {
        name: 'those',
        data: [7, 1, 3, 11, 15, 37, 49]
    }, {
        name: 'these',
        data: [108, 301, 504, 1056, 3039, 8018, 10201]
    }, {
        name: 'this too',
        data: [10, 30, 50, 105, 303, 801, 1020]
    }]
}

new Highcharts.Chart(config);

	}
});
build.js:
({
    baseUrl: '',
    paths: {
        jquery_hc: "../jquery-3.2.1",
        hchart: "../highcharts",
        'areaChart': 'areaChart'
    },
    shim: {
    	'hchart' : {
    		deps: ["jquery_hc"],
    		exports: 'Highcharts'
    	}
    },
    name: 'areaChart',
    out: "areaChart.min.js"
})
高图表使用最新的highchart.js和jquery-3.2.1.js。
很少有东西我试着添加颜色:
- 使用主题将图表的主颜色
- 设置plotOptions.fillColor: null
- 设置plotOptions.fillColor:#927453
- 将plotOptions设置为“区域”中的“系列”
- 设置plotOptions.color:相同颜色
也许很少有其他基于高级图表的API引用的东西。
另一方面,如果我把plotOptions.fillColor:'#ffffff',所有更改的颜色,这意味着问题主要是匹配每个数据集的一种颜色。
一个巨大的问题是,这个在JSFiddle (JSFiddle)中是不可复制的。
所以,贾斯珀的报告可能是罪魁祸首,但我已经开始失去想法了。我发现了一个可能与此相关的问题:(https://
community.jaspersoft.com/jaspersoft-studio/issues/8641),但是我还不能用这个设置来做很多事情。我的web应用程序正在使用jasper引擎来生成报告,这个问题也存在于其中。
StackOverflow的员工,高图表的员工和Jaspersoft的员工,结合您的知识,帮助我解决这个问题!
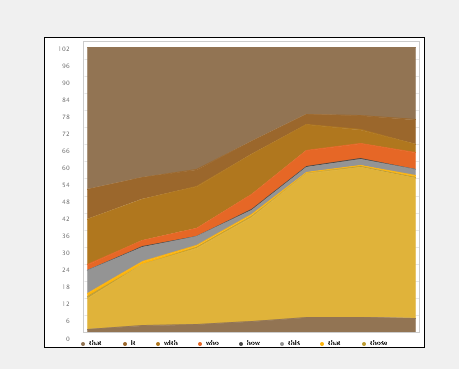
最后,生成报告的Jasper Report工作室的图片:
回答 1
Stack Overflow用户
发布于 2017-09-29 21:16:32
在查看代码之后,我发现当我们看到HTML格式的报表时,它是正常工作的,但是pdf格式不能正常工作。当我们知道CVC组件使用phantmjs来下载报告时,我试着搜索与幻影和高级图表相关的问题,但是找不到任何东西。
然后,我尝试了查找plotOption属性,并将plotOption添加到代码中。
plotOptions: {
   series: {
        animation: false,
        stacking: 'percent',
        lineWidth: 1,
        fillColor: null,
        fillOpacity: 1, // this is default to 0.75
        marker: {
           enabled: false
        }
    }
},
然后开始以PDF格式显示结果。因此,主要的罪魁祸首是fillOpacity,如果您将其设置为1,那么您的问题就会得到解决。
注意:如果您使用的是1以外的fillOpacity,那么它没有显示结果.
您还可以指定颜色、填充颜色和不透明度,如下所示。
series: [{
        name: 'that',
        data: [502, 635, 809, 947, 1402, 3634, 5268],
        fillColor:'red', // use this color light as compared to color
        fillOpacity: 1,
        color: 'white'   // use this color dark as compared to fillcolor
    },
    ...
    ...
    ...
    ,{
        name: 'this too',
        data: [10, 30, 50, 105, 303, 801, 1020],
        fillColor:'#00ff00',
        fillOpacity: 1,
        color: 'orange'
}]您可以从这里。下载代码。
https://stackoverflow.com/questions/46489252
复制相似问题
腾讯云开发者

Copyright © 2013 - 2026 Tencent Cloud. All Rights Reserved. 腾讯云 版权所有
深圳市腾讯计算机系统有限公司 ICP备案/许可证号:粤B2-20090059 ![]() 粤公网安备44030502008569号
粤公网安备44030502008569号
腾讯云计算(北京)有限责任公司 京ICP证150476号 | 京ICP备11018762号