
用相同颜色的图例在侧面订购酒壶。
用相同颜色的图例在侧面订购酒壶。
提问于 2017-09-27 17:18:03
使用数据集:
library(tidyverse)
df1 <- structure(list(dept = c("A", "B", "C"),
n = c(70908L, 50004L, 294614L)), class = c("tbl_df", "tbl",
"data.frame"), row.names = c(NA, -3L), .Names = c("dept", "n"))
df2 <- structure(list(dept = c("A", "B", "D", "E"),
n = c(544L, 684L, 375L, 1191L)), class = c("tbl_df", "tbl", "data.frame"),
row.names = c(NA, -4L), .Names = c("dept", "n"))
> df1
# A tibble: 3 x 2
dept n
<chr> <int>
1 A 70908
2 B 50004
3 C 294614
> df2
# A tibble: 4 x 2
dept n
<chr> <int>
1 A 544
2 B 684
3 D 375
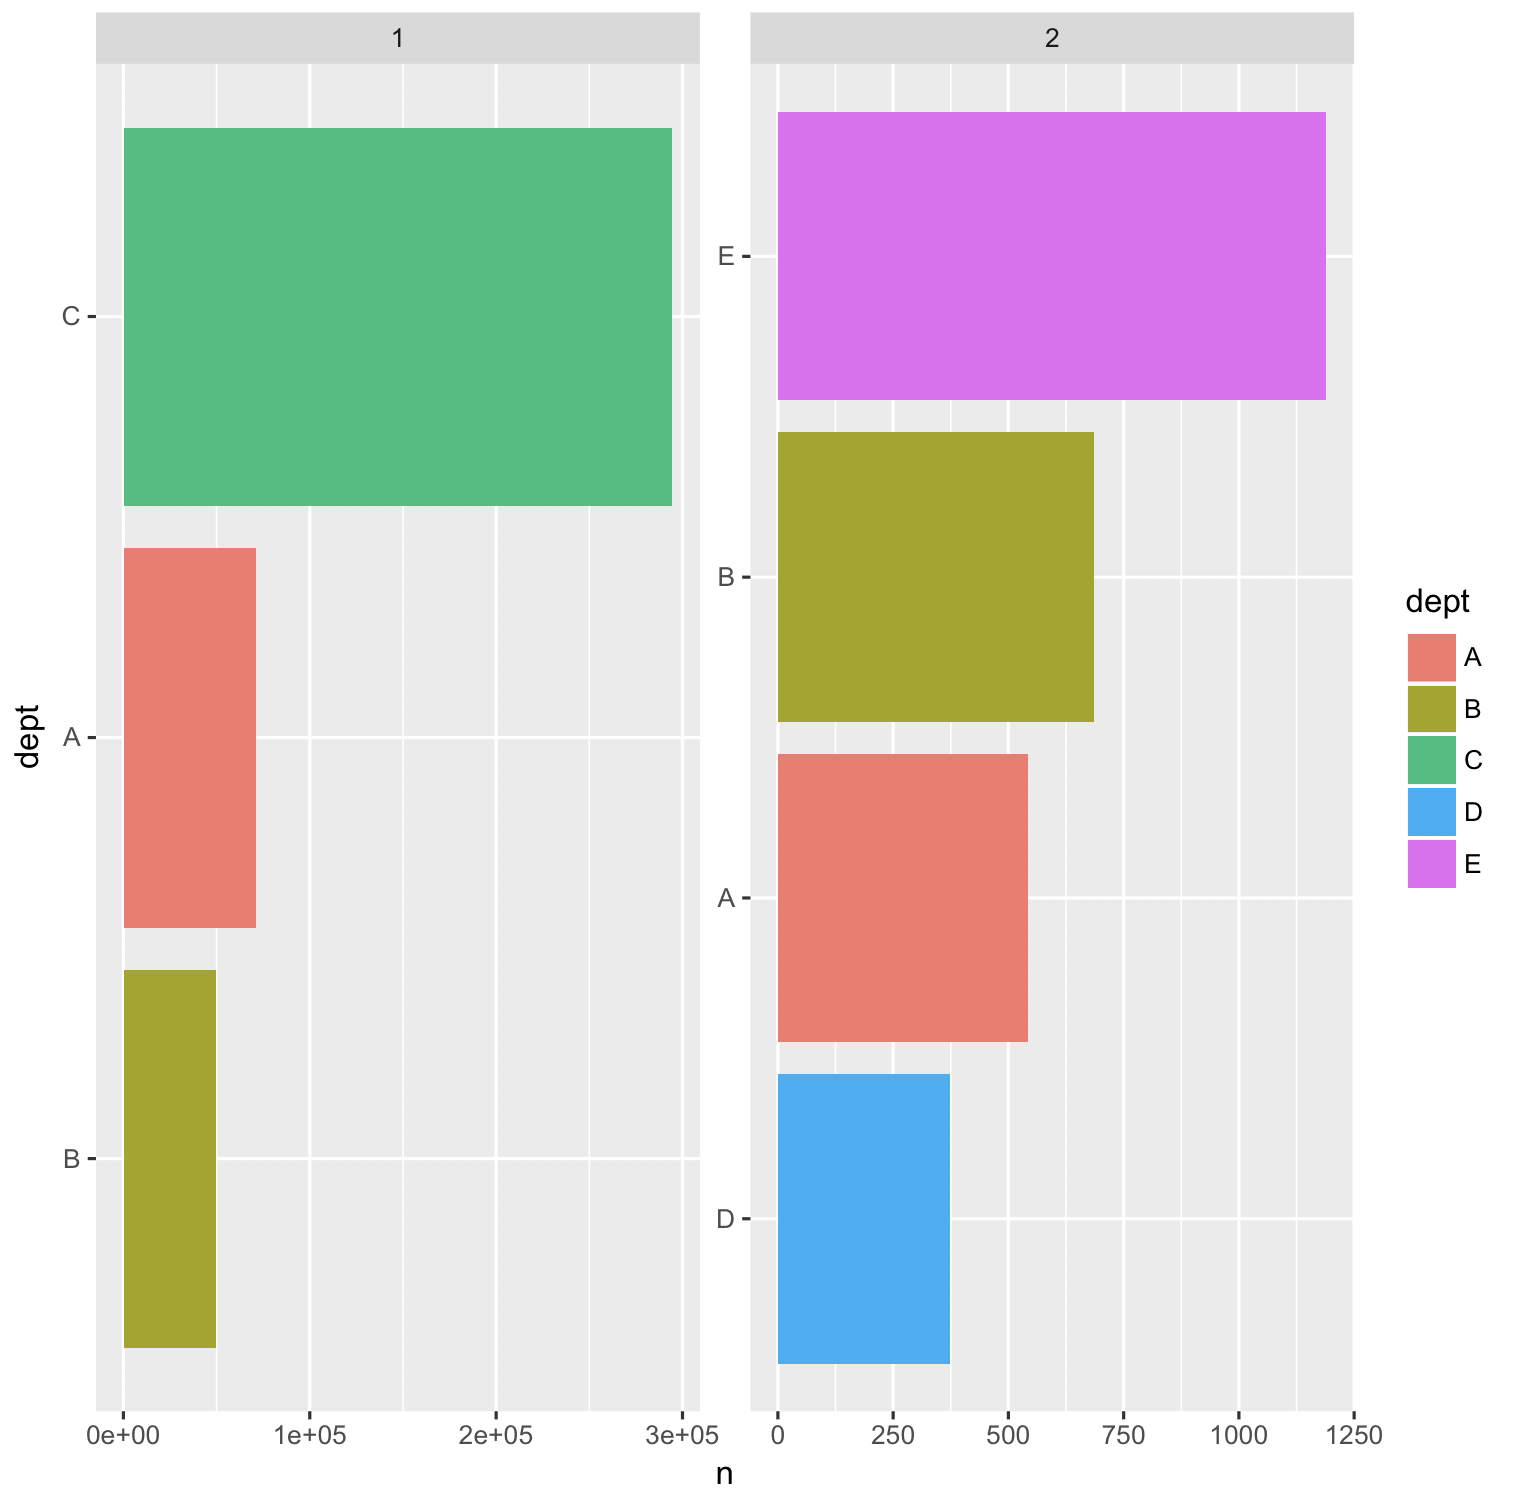
4 E 1191我想用相同的填充/图例在侧面创建一个有序的桶形图。到目前为止,我能做到的是:
df <- rbind(df1 %>% mutate(source = 1),
       df2 %>% mutate(source = 2))

df %>% ggplot(aes(reorder(dept, n), n, fill = dept)) +
  geom_bar(stat = "identity") +
  coord_flip() +
  facet_wrap(~source, scales = "free")
如何使reorder函数在各个方面工作?
回答 1
Stack Overflow用户
回答已采纳
发布于 2017-09-27 18:03:29
若要对两个方面中的值进行排序,请使用它创建新列var3和reorder。之后,只需将scale_x_discrete中的标签从var3更改为dept。
library(tidyverse)
df <- rbind(df1 %>% mutate(source = 1),
            df2 %>% mutate(source = 2)) %>%
    mutate(var3 = paste(source, dept))
ggplot(df, aes(reorder(var3, n), n, fill = dept)) +
    geom_bar(stat = "identity") +
    coord_flip() +
    xlab("dept") +
    facet_wrap(~ source, scales = "free") +
    scale_x_discrete(breaks = df$var3, labels = df$dept)
页面原文内容由Stack Overflow提供。腾讯云小微IT领域专用引擎提供翻译支持
原文链接:
https://stackoverflow.com/questions/46453728
复制相关文章
相似问题
腾讯云开发者

Copyright © 2013 - 2026 Tencent Cloud. All Rights Reserved. 腾讯云 版权所有
深圳市腾讯计算机系统有限公司 ICP备案/许可证号:粤B2-20090059 ![]() 粤公网安备44030502008569号
粤公网安备44030502008569号
腾讯云计算(北京)有限责任公司 京ICP证150476号 | 京ICP备11018762号