
显示了阿姆图,但控制台输出了一个错误。
显示了阿姆图,但控制台输出了一个错误。
提问于 2017-09-14 10:31:56
我使用a来显示一个图表,并在一个引导组件中为它做了一个div。下面是我的html & js代码:
<fieldset>
    <legend>Chart</legend>
    <div class="row">
    <form class="form-horizontal mb-sm line-height-3">
        <div class="col-sm-3 col-md-3">
        <div class="form-group">
            <label for="submitStartTime" class="col-sm-3 control-label">Start Time</label>
            <div class="col-sm-6">
                <label id="submitStartTime"></label>
            </div>
        </div>
        <div id="latencyChart" class="col-sm-9 col-md-9" style="height: 400px;"></div>
    </form>
    </div>
</fieldset>
联署材料:
drawChart: function(graphType){
            var that = this;

            that.generateChartData();

            this.chart.dataProvider = this.chartData;
            this.chart.categoryField = "date";
            this.chart.balloon.bulletSize = 5;

            // listen for "dataUpdated" event (fired when chart is rendered) and call zoomChart method when it happens
            this.chart.addListener("dataUpdated", that.zoomChart());

            // AXES
            // category
            var categoryAxis = this.chart.categoryAxis;
            categoryAxis.parseDates = true; // as our data is date-based, we set parseDates to true
            categoryAxis.minPeriod = "DD"; // our data is daily, so we set minPeriod to DD
            categoryAxis.dashLength = 1;
            categoryAxis.minorGridEnabled = true;
            categoryAxis.twoLineMode = true;
            categoryAxis.dateFormats = [{
                period: 'fff',
                format: 'JJ:NN:SS'
            }, {
                period: 'ss',
                format: 'JJ:NN:SS'
            }, {
                period: 'mm',
                format: 'JJ:NN'
            }, {
                period: 'hh',
                format: 'JJ:NN'
            }, {
                period: 'DD',
                format: 'DD'
            }, {
                period: 'WW',
                format: 'DD'
            }, {
                period: 'MM',
                format: 'MMM'
            }, {
                period: 'YYYY',
                format: 'YYYY'
            }];

            categoryAxis.axisColor = "#DADADA";

            // value
            var valueAxis = new AmCharts.ValueAxis();
            valueAxis.axisAlpha = 0;
            valueAxis.dashLength = 1;
            this.chart.addValueAxis(valueAxis);

            // GRAPH
            var graph = new AmCharts.AmGraph();
            graph.title = "red line";
            graph.valueField = "visits";
            graph.bullet = "round";
            graph.bulletBorderColor = "#FFFFFF";
            graph.bulletBorderThickness = 2;
            graph.bulletBorderAlpha = 1;
            graph.lineThickness = 2;
            graph.lineColor = "#5fb503";
            graph.negativeLineColor = "#efcc26";
            graph.hideBulletsCount = 50; // this makes the chart to hide bullets when there are more than 50 series in selection
            this.chart.addGraph(graph);

            // SCROLLBAR
            var chartScrollbar = new AmCharts.ChartScrollbar();
            this.chart.addChartScrollbar(chartScrollbar);

            this.chart.creditsPosition = "bottom-right";

            // WRITE
            this.chart.write("latencyChart");
            this.chart.write("chartdiv");
        },

        // this method is called when chart is first inited as we listen for "dataUpdated" event
        zoomChart: function() {
            // different zoom methods can be used - zoomToIndexes, zoomToDates, zoomToCategoryValues
            this.chart.zoomToIndexes(this.chartData.length - 40, this.chartData.length - 1);
        },

        generateChartData: function(){
             var firstDate = new Date();
             firstDate.setDate(firstDate.getDate() - 10);
             for (var i = 0; i < 10; i++) {
                 // we create date objects here. In your data, you can have date strings
                 // and then set format of your dates using chart.dataDateFormat property,
                 // however when possible, use date objects, as this will speed up chart rendering.
                 var newDate = new Date(firstDate);
                 newDate.setDate(newDate.getDate() + i);

                 var visits = Math.round(Math.random() * 40) - 20;

                 this.chartData.push({
                     date: newDate,
                     visits: visits
                 });
             }
        },
this.chart是js代码中的一个全局变量,它已经初始化了。图表显示在我的页面中如下所示。
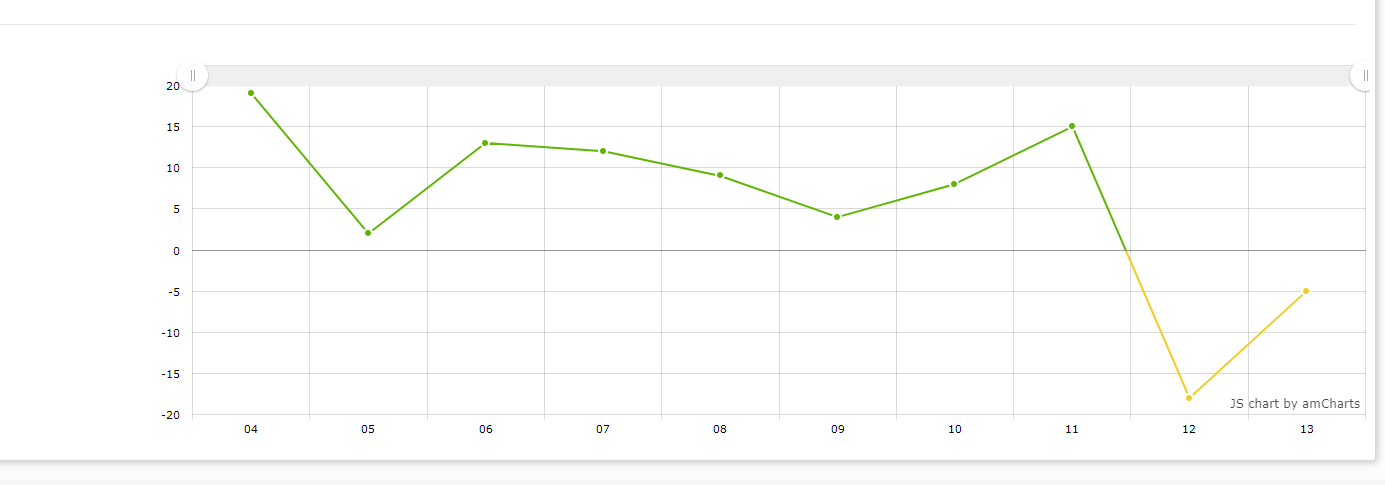
但是Chrome控制台提供了一些错误信息,如下所示。
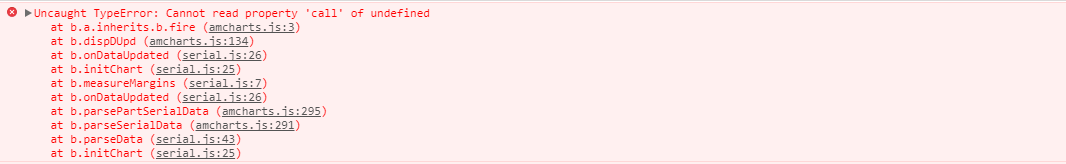
我调试了一段时间,发现错误发生在this.chart.write("latencyChart")中。错误无法读取未定义的属性“调用”。然后,我在这个页面中创建了一个名为"chartdiv“的新div,以了解程序是否仍能工作,并在原始的div之后添加了this.chart.write(”chartdiv“)。我发现"chartdiv“中没有图表,而且错误还在继续。
回答 1
Stack Overflow用户
回答已采纳
发布于 2017-09-14 19:43:20
问题在于如何将zoomChart方法与您的dataUpdated事件相结合-- that.zoomChart()正在调用zoomChart方法,而不是将其分配给事件。您需要创建一个调用zoomChart的函数,以便它能够在事件期间访问对象的图表属性,即
this.chart.addListener("dataUpdated", function() {
  that.zoomChart()
});下面是一个具有此修复程序的小提琴。
或者,您可以使用事件参数对象以这种方式访问图表对象,而不是摆弄这个/那个/etc,例如:
  this.chart.addListener("dataUpdated", that.zoomChart);

// ...

  zoomChart: function(e) {
    // different zoom methods can be used - zoomToIndexes, zoomToDates, zoomToCategoryValues
    e.chart.zoomToIndexes(e.chart.dataProvider.length - 40, e.chart.dataProvider.length - 1);
},页面原文内容由Stack Overflow提供。腾讯云小微IT领域专用引擎提供翻译支持
原文链接:
https://stackoverflow.com/questions/46216746
复制相关文章
相似问题
腾讯云开发者

Copyright © 2013 - 2026 Tencent Cloud. All Rights Reserved. 腾讯云 版权所有
深圳市腾讯计算机系统有限公司 ICP备案/许可证号:粤B2-20090059 ![]() 粤公网安备44030502008569号
粤公网安备44030502008569号
腾讯云计算(北京)有限责任公司 京ICP证150476号 | 京ICP备11018762号