
将图例名称添加到matplotlib中的支持向量机绘图中
将图例名称添加到matplotlib中的支持向量机绘图中
提问于 2017-09-13 10:21:47
我在木星笔记本中使用matplotlib和mlx趋向,从Iris-dataset中绘制了一个支持向量机绘图。我试图在图例中得到物种名,而不是0,1和2。到目前为止,我的代码是:
from sklearn import svm
from mlxtend.plotting import plot_decision_regions

X = iris[['SepalLengthCm', 'SepalWidthCm']]
y = iris['SpecieID']

clf = svm.SVC(decision_function_shape = 'ovo')
clf.fit(X.values, y.values)

# Plot Decision Region using mlxtend's awesome plotting function
plot_decision_regions(X=X.values,
                      y=y.values,
                      clf=clf,
                      legend=2)

# Update plot object with X/Y axis labels and Figure Title
plt.xlabel(X.columns[0], size=14)
plt.ylabel(X.columns[1], size=14)
plt.title('SVM Decision Region Boundary', size=16)
其结果是:
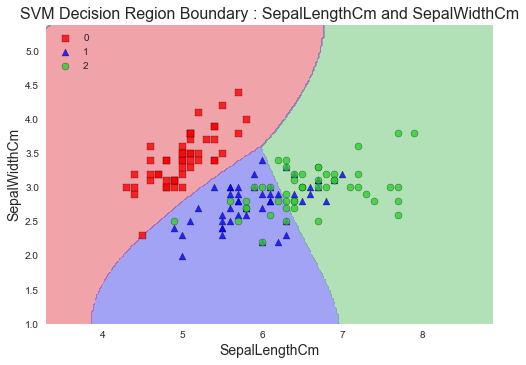
我找不到0,1和2的物种名称(Iris-setosa,Iris-versicolor和Iris-virginica)。
我通过以下方式创建了熊猫DataFrame:
import pandas as pd
iris = pd.read_csv("Iris.csv") # the iris dataset is now a Pandas DataFrame
iris = iris.assign(SepalRatio = iris['SepalLengthCm'] / iris['SepalWidthCm']).assign(PetalRatio = iris['PetalLengthCm'] / iris['PetalWidthCm']).assign(SepalMultiplied = iris['SepalLengthCm'] * iris['SepalWidthCm']).assign(PetalMultiplied = iris['PetalLengthCm'] * iris['PetalWidthCm'])
d = {"Iris-setosa" : 0, "Iris-versicolor": 1, "Iris-virginica": 2}
iris['SpecieID'] = iris['Species'].map(d).fillna(-1)回答 3
Stack Overflow用户
回答已采纳
发布于 2017-09-13 10:36:57
plot_decision_regions(X=X,
y=y,
clf=clf,
legend=2)
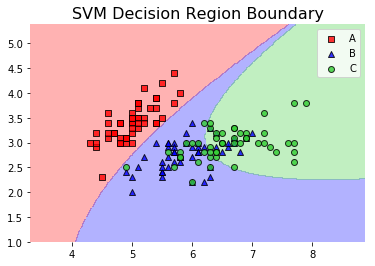
plt.title('SVM Decision Region Boundary', size=16)
L = plt.legend()
L.get_texts()[0].set_text('A')
L.get_texts()[1].set_text('B')
L.get_texts()[2].set_text('C')
Stack Overflow用户
发布于 2017-09-13 11:02:24
另一个借助当前绘图轴的句柄和标签,即
handles, labels =  plt.gca().get_legend_handles_labels()
plt.legend(handles, list(map(d.get, [int(i) for i in labels])) , loc= 'upper left') #Map the values of current labels with dictionary and pass it as labels parameter.
plt.show()
样本输出:
Stack Overflow用户
发布于 2018-07-12 14:33:17
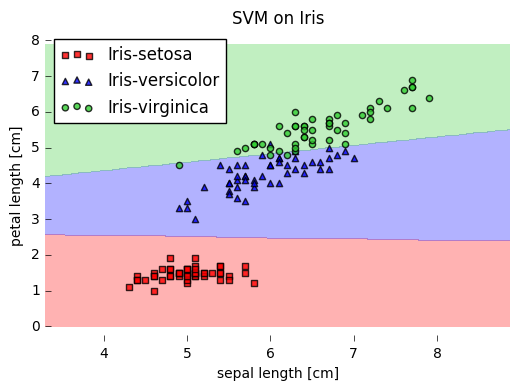
下面是@Dark的答案,下面是一个完整的代码以及突出显示的支持向量。
from mlxtend.plotting import plot_decision_regions
import matplotlib.pyplot as plt
from sklearn import datasets
from sklearn.svm import SVC

# Loading some example data
iris = datasets.load_iris()
X = iris.data[:, [0, 2]]
y = iris.target

# In case if the original data categories name were present
# then we replace them with numbers
d = {"Iris-setosa" : 0, "Iris-versicolor": 1, "Iris-virginica": 2}

# Training a classifier
svm = SVC(C=0.5, kernel='linear')
svm.fit(X, y)


# Plotting decision regions
plt.figure(figsize=(8,6))
plot_decision_regions(X, y, clf=svm, legend=2, X_highlight=svm.support_vectors_)

# Adding legend
handles, labels =  plt.gca().get_legend_handles_labels()
d_rev = {y:x for x,y in d.items()} # switching key-value pairs
plt.legend(handles, list(map(d_rev.get, [int(i) for i in d_rev])))

# Adding axes annotations
plt.xlabel('sepal length [cm]')
plt.ylabel('petal length [cm]')
plt.title('SVM on Iris')
plt.show()
页面原文内容由Stack Overflow提供。腾讯云小微IT领域专用引擎提供翻译支持
原文链接:
https://stackoverflow.com/questions/46194971
复制相关文章
相似问题
腾讯云开发者

Copyright © 2013 - 2026 Tencent Cloud. All Rights Reserved. 腾讯云 版权所有
深圳市腾讯计算机系统有限公司 ICP备案/许可证号:粤B2-20090059 ![]() 粤公网安备44030502008569号
粤公网安备44030502008569号
腾讯云计算(北京)有限责任公司 京ICP证150476号 | 京ICP备11018762号