
如何更改此代码以输出颜色直方图,取决于高度,而不是我选择的默认“酷”。
如何更改此代码以输出颜色直方图,取决于高度,而不是我选择的默认“酷”。
提问于 2017-09-08 20:14:11
此代码生成概率分布psi__x_squared。然后根据该概率进行马尔可夫链仿真。这个概率psi__x_squared实际上是能级n=0位于x位置的概率。根据这个概率移动x 1000次后,我想要生成位置x的直方图(位置频率)。
''' Markov-chain Monte Carlo algorithm for a particle in a Gaussian potential,
using the Metropolis algorithm. '''
import math, matplotlib.pyplot as plt, random

def probability(x):

    #wavefunction n=0 evaluated at position x
    psi_0_x=math.exp(-x ** 2 / 2.0) / math.pi ** 0.25

    #probability n=0 to be at position x
    psi_0_x_squared= psi_0_x**2

    return psi_0_x_squared

data_x=[0]

x = 0.0        #starts at position 0
delta = 0.5    #stepsize

for k in range(1000):    #for this number of trials
    x_new = x + random.uniform(-delta, delta) #I displace it a distance delta


    if random.uniform(0.0, 1.0) < probability(x_new)/probability(x):
        x = x_new
    data_x.append(x)

#histogram
cm = plt.cm.get_cmap('cool')
n, bins, patches= plt.hist(data_x, bins=100, normed=True, color='k')
bin_centers = 0.5 * (bins[:-1] + bins[1:])
col = bin_centers - min(bin_centers)
col /= max(col)
for c, p in zip(col, patches):
    plt.setp(p, 'facecolor', cm(c))

plt.show()回答 1
Stack Overflow用户
回答已采纳
发布于 2017-09-08 20:19:25
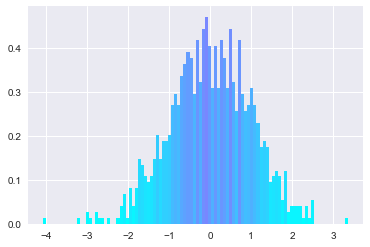
变量n包含条的高度。因此,这应该能起到以下作用:
for height, p in zip(n, patches):
    plt.setp(p, 'facecolor', cm(height))
就像这样:
a = np.random.normal(size=(1000,))

cm = plt.cm.get_cmap('cool')
n, bins, patches= plt.hist(a, bins=100, normed=True, color='k')
for c, p in zip(n, patches):
    plt.setp(p, 'facecolor', cm(c))
页面原文内容由Stack Overflow提供。腾讯云小微IT领域专用引擎提供翻译支持
原文链接:
https://stackoverflow.com/questions/46123927
复制相关文章
相似问题
腾讯云开发者

Copyright © 2013 - 2026 Tencent Cloud. All Rights Reserved. 腾讯云 版权所有
深圳市腾讯计算机系统有限公司 ICP备案/许可证号:粤B2-20090059 ![]() 粤公网安备44030502008569号
粤公网安备44030502008569号
腾讯云计算(北京)有限责任公司 京ICP证150476号 | 京ICP备11018762号