
Matplotlib -线连接点错误
Matplotlib -线连接点错误
提问于 2017-09-07 05:10:56
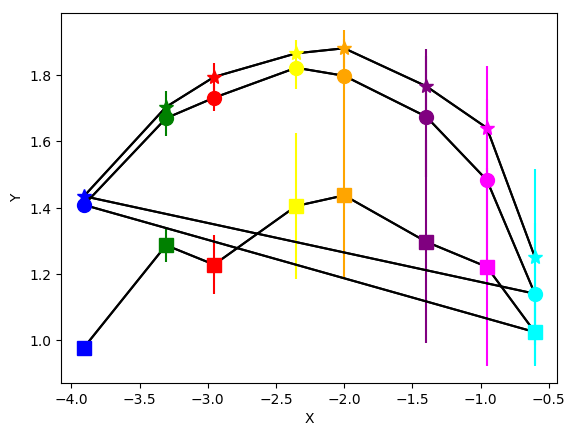
我正在通过matplotlib/pyplot作图。为什么星体和圆的起始点(蓝色)连接着一条线和最后的点?初始点星是连接最后点圆,初始点圆是连接最后点方。
这是源代码:
plt.plot(x,y, color="black")
plt.errorbar(x1,y1,yerr=err1,marker='s', markersize="10", mfc='blue', color='blue',fmt = '')
plt.errorbar(x2,y2,yerr=err2,marker='s', markersize="10", mfc='green', color='green',fmt = '')
plt.errorbar(x3,y3,yerr=err3,marker='s', markersize="10", mfc='red', color='red',fmt = '')
plt.errorbar(x4,y4,yerr=err4,marker='s', markersize="10", mfc='yellow', color='yellow',fmt = '')
plt.errorbar(x5,y5,yerr=err5,marker='s', markersize="10", mfc='orange', color='orange',fmt = '')
plt.errorbar(x6,y6,yerr=err6,marker='s', markersize="10", mfc='purple', color='purple',fmt = '')
plt.errorbar(x7,y7,yerr=err7,marker='s', markersize="10", mfc='magenta', color='magenta',fmt = '')
plt.errorbar(x8,y8,yerr=err8,marker='s', markersize="10", mfc='cyan', color='cyan',fmt = '')
plt.errorbar(x9,y9,yerr=err9,marker='o', markersize="10", mfc='blue', color='blue',fmt = '')
plt.errorbar(x10,y10,yerr=err10,marker='o', markersize="10", mfc='green', color='green',fmt = '')
plt.errorbar(x11,y11,yerr=err11,marker='o', markersize="10", mfc='red', color='red',fmt = '')
plt.errorbar(x12,y12,yerr=err12,marker='o', markersize="10", mfc='yellow', color='yellow',fmt = '')
plt.errorbar(x13,y13,yerr=err13,marker='o', markersize="10", mfc='orange', color='orange',fmt = '')
plt.errorbar(x14,y14,yerr=err14,marker='o', markersize="10", mfc='purple', color='purple',fmt = '')
plt.errorbar(x15,y15,yerr=err15,marker='o', markersize="10", mfc='magenta', color='magenta',fmt = '')
plt.errorbar(x16,y16,yerr=err16,marker='o', markersize="10", mfc='cyan', color='cyan',fmt = '')
plt.errorbar(x17,y17,yerr=err17,marker='*', markersize="10", mfc='blue', color='blue',fmt = '')
plt.errorbar(x18,y18,yerr=err18,marker='*', markersize="10", mfc='green', color='green',fmt = '')
plt.errorbar(x19,y19,yerr=err19,marker='*', markersize="10", mfc='red', color='red',fmt = '')
plt.errorbar(x20,y20,yerr=err20,marker='*', markersize="10", mfc='yellow', color='yellow',fmt = '')
plt.errorbar(x21,y21,yerr=err21,marker='*', markersize="10", mfc='orange', color='orange',fmt = '')
plt.errorbar(x22,y22,yerr=err22,marker='*', markersize="10", mfc='purple', color='purple',fmt = '')
plt.errorbar(x23,y23,yerr=err23,marker='*', markersize="10", mfc='magenta', color='magenta',fmt = '')
plt.errorbar(x24,y24,yerr=err24,marker='*', markersize="10", mfc='cyan',   color='cyan',fmt = '')
plt.savefig("image.png",bbox_inches='tight')
plt.show()
"x“变量是一个形状24数组。"y“变量是一个形状为24数组的"err”变量,只是实数。
回答 1
Stack Overflow用户
回答已采纳
发布于 2017-09-07 05:40:29
如果您想要绘制三条分别有八个点的线,则不能使用长度为24的两个数组“一次”绘制它们。相反,将你的数据分割成三个独立的和平,并分别绘制它们:
plot(x[0:8],y[0:8],'black')
plot(x[8:16],y[8:16],'black')
plot(x[16:24],y[16:24],'black')这应该能起作用。还要注意,通过使用errorbar和for语句,您可以大大缩短您的lists代码。例如,你可以
errs = [err1,err2,err3,err4,err5,err6,err7,err8] #probably you did have these in a list or array anyway
cols = ['b','g','r','y','orange','purple','m','c']

for i,(errval,col) in enumerate(zip(errs,cols)):
plt.errorbar(x[i],y[i],yerr=errvall, marker='s', markersize="10", mfc=col, color=col,fmt = '')使用另一个for循环,您仍然可以遍历markers。希望这能有所帮助。
页面原文内容由Stack Overflow提供。腾讯云小微IT领域专用引擎提供翻译支持
原文链接:
https://stackoverflow.com/questions/46088269
复制相关文章
相似问题
腾讯云开发者

Copyright © 2013 - 2026 Tencent Cloud. All Rights Reserved. 腾讯云 版权所有
深圳市腾讯计算机系统有限公司 ICP备案/许可证号:粤B2-20090059  粤公网安备44030502008569号
腾讯云计算(北京)有限责任公司 京ICP证150476号 | 京ICP备11018762号