
用ggplot2绘制的瓷砖--同一瓷砖中的两种美学导致图形故障
TL;DR -创建瓷砖情节,两个美学在同一瓷砖导致瓷砖颜色不呈现,不确定是我的代码或什么与ggplot2,有人经历过吗?
我遇到了一个奇怪的绘图问题(不是一个错误,它默默地失败了,我只是在查看最终表示时才注意到这个问题),当我试图使用ggplot在同一个瓷砖中绘制多个美学时,我才会注意到这个问题。
我的数据:
satur_muts <- structure(list(id = c("0400136_T1", "0400136_T1", "0400136_T1",
"0400136_T1", "0400171_T1", "0400171_T1", "0400171_T1", "0400171_T1",
"0400179_T1", "0400179_T1", "0400179_T1", "0400195_T1", "0400195_T1",
"0400195_T1", "0400195_T1"), gene = c("CDKN2A", "TP53", "KRAS",
"KRAS", "CDKN2A", "TP53", "KRAS", "KRAS", "CDKN2A", "TP53", "KRAS",
"CDKN2A", "TP53", "KRAS", "KRAS"), mut_type = structure(c(NA,
NA, 1L, NA, NA, NA, NA, 1L, NA, NA, 1L, NA, NA, 1L, NA), .Label = "Missense", class = "factor"),
    is_cnv = c(NA, NA, FALSE, TRUE, NA, NA, TRUE, FALSE, NA,
    NA, FALSE, NA, NA, FALSE, TRUE)), row.names = c(NA, -15L), .Names = c("id",
"gene", "mut_type", "is_cnv"), class = c("tbl_df", "tbl", "data.frame"
))

cnv_dat <- structure(list(id = structure(1:3, .Label = c("0400136_T1", "0400171_T1",
"0400195_T1"), class = "factor"), gene = structure(c(1L, 1L,
1L), .Label = "KRAS", class = "factor"), mut_type = structure(c(NA_integer_,
NA_integer_, NA_integer_), .Label = character(0), class = "factor"),
    cnv = structure(c(1L, 1L, 1L), .Label = "High-level amplification", class = "factor"),
    is_cnv = c(TRUE, TRUE, TRUE)), row.names = c(NA, -3L), .Names = c("id",
"gene", "mut_type", "cnv", "is_cnv"), class = c("tbl_df", "tbl",
"data.frame"))

cb_palette <- c("Missense" = "#095481",
                "Splice site" = "#DE5423",
                "Frameshift" = "#179F30",
                "Nonsense" = "#F5B02C",
                "Nonstop" = "#FF69B4",
                "In-frame indel" = "#9C39B6")

mut_levels = c("Missense", "Splice site", "Frameshift", "Nonsense", "Nonstop", "In-frame indel")
我的代码:
library(dplyr); library(readr); library(ggplot2)
p1 <- ggplot(data = satur_muts) +
  geom_tile(mapping = aes(x = id, y = gene, fill = mut_type), height=0.9, width=0.9) +
  scale_fill_manual(values = cb_palette, na.value = "Grey95", drop = F,
                    guide = guide_legend(title = "Somatic mutations", override.aes = list(size=4.5))  ,
                    breaks = unique(satur_muts$mut_type)[order(mut_levels)] %>% na.omit()) +
  geom_tile(data = filter(satur_muts, gene == ""),
            mapping = aes(x=id, y=gene),
            fill = "white",
            height = 1, width = 1)

o <- levels(cnv_dat$cnv)
v_tuple <- c("High-level amplification"= 24, "Homozygous deletion" = 25)
b <- c("High-level amplification", "Homozygous deletion")
keep <- which( names(v_tuple) %in% unique(cnv_dat$cnv)[ order(o) ] )
p2 <- p1 +
  geom_point(data = cnv_dat,  aes(x = id, y = gene, shape = cnv),
             fill = "grey", size = 3, stroke = 0.5, inherit.aes = F) +
  scale_shape_manual(values = v_tuple[keep],
                     breaks = b[keep]) +
  guides(shape = guide_legend(title = "Somatic Copy Number Aberration"), override.aes = list(size=4.5), drop = T )
p2
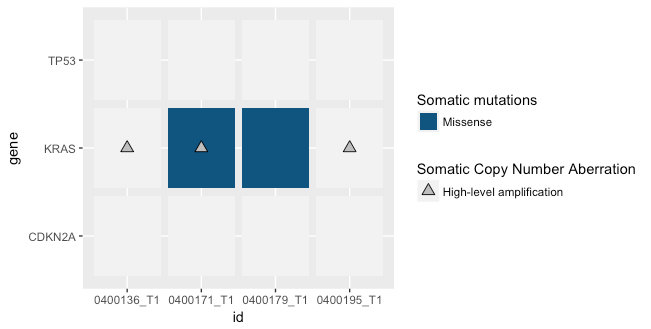
根据我下面的数据检查,最后一个蓝色和向上三角形瓷砖左边的两个瓷砖也应该有一个蓝色背景。我不明白为什么一个样本绘制正确,而另一个样本不正确。
mt <- left_join(satur_muts, cnv_dat) %>% filter(!is.na(is_cnv))
t <- mt %>% filter(gene == "KRAS")

# A tibble: 7 × 5
          id  gene mut_type is_cnv                      cnv
       <chr> <chr>    <chr>  <lgl>                   <fctr>
1 0400136_T1  KRAS Missense  FALSE                       NA
2 0400136_T1  KRAS     <NA>   TRUE High-level amplification
3 0400171_T1  KRAS     <NA>   TRUE High-level amplification
4 0400171_T1  KRAS Missense  FALSE                       NA
5 0400179_T1  KRAS Missense  FALSE                       NA
6 0400195_T1  KRAS Missense  FALSE                       NA
7 0400195_T1  KRAS     <NA>   TRUE High-level amplification
Rsession信息
R version 3.3.2 (2016-10-31)
Platform: x86_64-apple-darwin13.4.0 (64-bit)
Running under: macOS Sierra 10.12

locale:
[1] en_US.UTF-8/en_US.UTF-8/en_US.UTF-8/C/en_US.UTF-8/en_US.UTF-8

attached base packages:
[1] parallel  grid      stats     graphics  grDevices utils     datasets  methods   base

other attached packages:
 [1] viridis_0.3.4      RColorBrewer_1.1-2 doMC_1.3.4         iterators_1.0.8    foreach_1.4.3      cowplot_0.7.0      lattice_0.20-34    gridExtra_2.2.1    readxl_0.1.1
[10] forcats_0.2.0      stringr_1.2.0      devtools_1.12.0    dplyr_0.5.0        purrr_0.2.2        readr_1.0.0        tidyr_0.6.2        tibble_1.3.0       ggplot2_2.2.1
[19] tidyverse_1.1.1

loaded via a namespace (and not attached):
 [1] Rcpp_0.12.10     plyr_1.8.4       tools_3.3.2      digest_0.6.12    jsonlite_1.4     lubridate_1.6.0  memoise_1.0.0    gtable_0.2.0     nlme_3.1-131     psych_1.6.12
[11] DBI_0.5-1        haven_1.0.0      withr_1.0.2      httr_1.2.1       xml2_1.1.1       hms_0.3          R6_2.2.0         foreign_0.8-67   reshape2_1.4.2   modelr_0.1.0
[21] magrittr_1.5     codetools_0.2-15 scales_0.4.1     assertthat_0.1   mnormt_1.5-5     rvest_0.3.2      colorspace_1.3-2 labeling_0.3     stringi_1.1.5    lazyeval_0.2.0
[31] munsell_0.4.3    broom_0.4.2
和Rstudio版本
$version
[1] ‘1.0.136’回答 1
Stack Overflow用户
发布于 2017-08-30 21:29:54
这引起了我的注意,通过这个练习,在satur_muts中传递一个reprex,一个包含非唯一(x,y)配对的表,使ggplot“猜测”要使用的配对,即使指定了一个美学(按照上面的代码)。
首先获取适当的输入数据,以生成平铺地块背景(satur_muts):
genes <- structure(c(2L, 3L, 1L), .Label = c("CDKN2A", "KRAS", "TP53"), class = "factor")

ids <- structure(1:4, .Label = c("0400136_T1", "0400171_T1", "0400179_T1",
    "0400195_T1"), class = "factor")

the_muts <- structure(list(id = c("0400136_T1", "0400171_T1", "0400179_T1",
"0400195_T1"), gene = c("KRAS", "KRAS", "KRAS", "KRAS"), mut_type = structure(c(1L,
1L, 1L, 1L), .Label = "Missense", class = "factor"), is_cnv = c(FALSE,
FALSE, FALSE, FALSE), cnv = c("No High-level CNV", "No High-level CNV",
"No High-level CNV", "No High-level CNV")), row.names = c(NA,
-4L), .Names = c("id", "gene", "mut_type", "is_cnv", "cnv"), class = c("tbl_df",
"tbl", "data.frame"))做出正确的satur_muts:
library(dplyr)
satur_muts_expand <- expand.grid(gene = genes, id = ids) %>% as_data_frame()
new_satur_muts <- left_join(satur_muts_expand, the_muts %>% filter(!is.na(mut_type), !is_cnv) %>% distinct(), by = c("gene", "id"))
不是:
satur_muts <- left_join(satur_muts_expand, the_muts, by = c("gene", "id")) 你应该得到这个:
new_satur_muts <- structure(list(gene = c("KRAS", "TP53", "CDKN2A", "KRAS", "TP53",
"CDKN2A", "KRAS", "TP53", "CDKN2A", "KRAS", "TP53", "CDKN2A"),
    id = c("0400136_T1", "0400136_T1", "0400136_T1", "0400171_T1",
    "0400171_T1", "0400171_T1", "0400179_T1", "0400179_T1", "0400179_T1",
    "0400195_T1", "0400195_T1", "0400195_T1"), mut_type = structure(c(1L,
    NA, NA, 1L, NA, NA, 1L, NA, NA, 1L, NA, NA), .Label = "Missense", class = "factor")), row.names = c(NA,
-12L), .Names = c("gene", "id", "mut_type"), class = c("tbl_df", "tbl","data.frame"))并且使用来自OP和satur_muts <- new_satur_muts的satur_muts <- new_satur_muts,运行与上面相同的代码解决了这个问题(通过一些theme调整和coord_fixed())
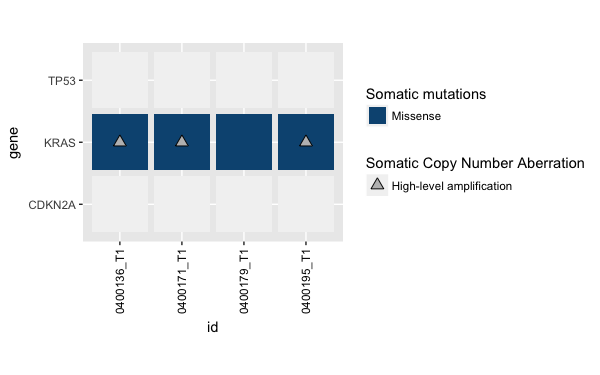
基本上,如果您试图在同一块瓷砖中绘制多种美学(颜色、符号等),则会出现此问题。所以在这个例子中,我必须确保每个样本基因配对在绘制突变(颜色)的表中是唯一的,然后叠加附加信息(cnv)是一个单独的表。因此,这并不是一个图形问题,而是输入数据的质量在绘制之前包含的问题。谢谢大家的帮助!
https://stackoverflow.com/questions/45963225
复制相似问题
腾讯云开发者

Copyright © 2013 - 2026 Tencent Cloud. All Rights Reserved. 腾讯云 版权所有
深圳市腾讯计算机系统有限公司 ICP备案/许可证号:粤B2-20090059 ![]() 粤公网安备44030502008569号
粤公网安备44030502008569号
腾讯云计算(北京)有限责任公司 京ICP证150476号 | 京ICP备11018762号