
JavaFX直线图-数据点之间的不同颜色
JavaFX直线图-数据点之间的不同颜色
提问于 2017-08-25 11:13:44
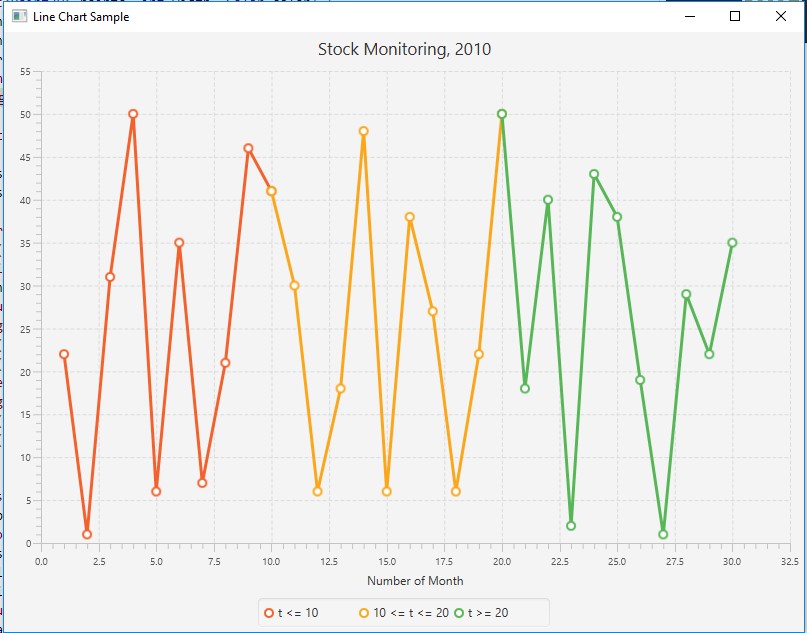
在我们的JavaFX项目中,我们需要一个在数据点之间有不同颜色的线条图(一个数据级),这取决于以下规则:(t=time)
如果值t(x) < t(x+1),则=>颜色应为绿色
如果值t(x) > t(x+1),则=>颜色应为红色
如果值t(x) = t(x+1),则=>颜色应为灰色
我可以很容易地改变整个线条图的颜色使用CSS,但我不知道如何解决这个问题!
回答 1
Stack Overflow用户
回答已采纳
发布于 2017-08-25 15:47:56
下面是一个关于如何连接不同Series的简单示例。代码中的注释。
import java.util.Random;
import javafx.application.Application;
import javafx.scene.Scene;
import javafx.scene.chart.LineChart;
import javafx.scene.chart.NumberAxis;
import javafx.scene.chart.XYChart;
import javafx.stage.Stage;


public class LineChartSample extends Application {

    @Override public void start(Stage stage) {
        stage.setTitle("Line Chart Sample");
        //defining the axes
        final NumberAxis xAxis = new NumberAxis();
        final NumberAxis yAxis = new NumberAxis();
        xAxis.setLabel("Number of Month");
        //creating the chart
        final LineChart<Number,Number> lineChart =
                new LineChart<Number,Number>(xAxis,yAxis);

        lineChart.setTitle("Stock Monitoring, 2010");
        //defining a series
        XYChart.Series series1 = new XYChart.Series();
        XYChart.Series series2 = new XYChart.Series();
        XYChart.Series series3 = new XYChart.Series();

        series1.setName("t <= 10");
        series2.setName("10 <= t <= 20");
        series3.setName("t >= 20");
        //populating the series with data

        Random random = new Random();

        int whenIEquals10 = -1;//Used to store the value to start second series. This will be the last value in the first series.
        int whenIEquals20 = -1;//Used to store the value to start third series. This will be the last value in the second series.

        for(int i = 1; i <= 30; i++)
        {
            if(i <= 10)//range of first series
            {
                int randomNumber = random.nextInt(50) + 1;//Populate graph with random numbers.
                series1.getData().add(new XYChart.Data(i, randomNumber));
                if(i == 10)//The first series ends at 10, so save this value to start the second series.
                {
                    whenIEquals10 = randomNumber;
                }
            }
            if(i >= 10 && i <= 20)//Range of second series.
            {
                int randomNumber = random.nextInt(50) + 1;
                if(i == 10)//Start this second series with the last value from the first series.
                {
                    randomNumber = whenIEquals10;
                }

                series2.getData().add(new XYChart.Data(i, randomNumber));

                if(i == 20)//The second series ends at 20, so save this value to start the third series.
                {
                    whenIEquals20 = randomNumber;
                }
            }
            if(i >= 20)//Range of thired series.
            {
                int randomNumber = random.nextInt(50) + 1;
                if(i == 20)//Start this third series with the last value from the second series.
                {
                    randomNumber = whenIEquals20;
                }

                series3.getData().add(new XYChart.Data(i, randomNumber));
            }
        }

        Scene scene  = new Scene(lineChart,800,600);
        lineChart.getData().addAll(series1, series2, series3);

        stage.setScene(scene);
        stage.show();
    }

    public static void main(String[] args) {
        launch(args);
    }
}
页面原文内容由Stack Overflow提供。腾讯云小微IT领域专用引擎提供翻译支持
原文链接:
https://stackoverflow.com/questions/45880098
复制相关文章
相似问题
腾讯云开发者

Copyright © 2013 - 2026 Tencent Cloud. All Rights Reserved. 腾讯云 版权所有
深圳市腾讯计算机系统有限公司 ICP备案/许可证号:粤B2-20090059  粤公网安备44030502008569号
腾讯云计算(北京)有限责任公司 京ICP证150476号 | 京ICP备11018762号