
在ggplot2树状图中增加叶与标签之间的空间
在ggplot2树状图中增加叶与标签之间的空间
提问于 2017-08-23 12:20:46
我需要用ggplot2绘制聚类树状图。为了创建树状图对象,我使用了来自as.ggdend()包的dendextend函数。然而,叶子和标签之间的空间很小(见下图)。知道怎么增加吗?
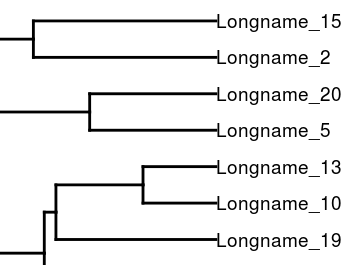
下面粘贴了再现示例的代码。
library(ggplot2)
library(dendextend)

## Sample 20 instances of iris dataset
data(iris)
df   <- iris[sample(150, 20), -5]
labs <- paste("Longname_", 1:20, sep = "")
rownames(df) <- labs

## Create dendrogram object
dend <- df %>% dist %>%
  hclust %>% as.dendrogram %>%
  set("labels_cex", 1)
ggd1 <- as.ggdend(dend)

## Plot dendrogram
ggplot(ggd1, horiz = TRUE)回答 1
Stack Overflow用户
回答已采纳
发布于 2017-08-26 09:47:23
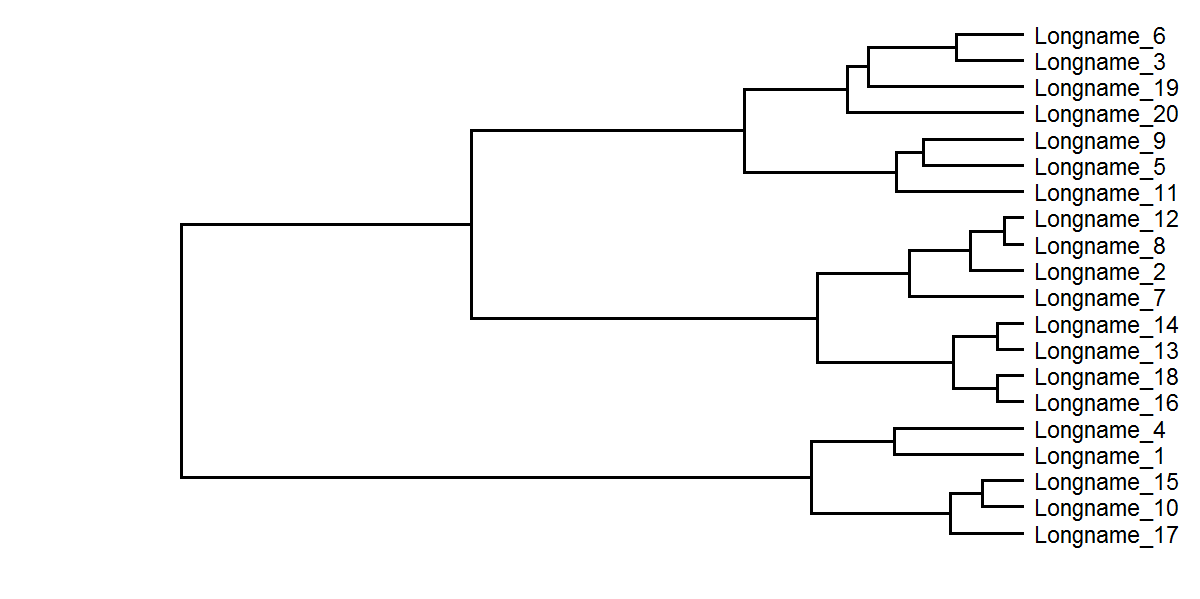
在我看来,工作的宽度和高度,你的情节可以是一个简单和有价值的解决方案,你的问题。
library(ggplot2)
library(dendextend)
data(iris)
df   <- iris[sample(150, 20), -5]

## Add blanks before "Longname_"
labs <- paste("  Longname_", 1:20, sep = "")
rownames(df) <- labs

dend <- df %>% dist %>%
  hclust %>% as.dendrogram %>%
  set("labels_cex", 1)
ggd1 <- as.ggdend(dend)

## Resize width and height plotting area
x11(width=10, height=5)
ggplot(ggd1, horiz = TRUE)
页面原文内容由Stack Overflow提供。腾讯云小微IT领域专用引擎提供翻译支持
原文链接:
https://stackoverflow.com/questions/45839571
复制相关文章
相似问题
腾讯云开发者

Copyright © 2013 - 2026 Tencent Cloud. All Rights Reserved. 腾讯云 版权所有
深圳市腾讯计算机系统有限公司 ICP备案/许可证号:粤B2-20090059 ![]() 粤公网安备44030502008569号
粤公网安备44030502008569号
腾讯云计算(北京)有限责任公司 京ICP证150476号 | 京ICP备11018762号