
在使用DataFrame时,如何使用来自plotly+cufflinks的多个直方图的特定回收箱列表?
在用matplotlib绘制直方图时,手动给出一个回收箱列表相对容易,例如,这里。
这方面的一个简单例子如下:
import numpy as np
import matplotlib.pyplot as plt

fig, ax = plt.subplots()
ax.hist(np.random.randn(10000), bins=np.arange(-4, 4, 0.1))
ax.hist(0.2 * np.random.randn(10000), bins=np.arange(-4, 4, 0.1))
plt.show()
这也可以从具有以下内容的pandas.DataFrame中等效地完成:
pd.DataFrame({
    'firstHistogram': np.random.randn(10000),
    'secondHistogram': 0.2 * np.random.randn(10000)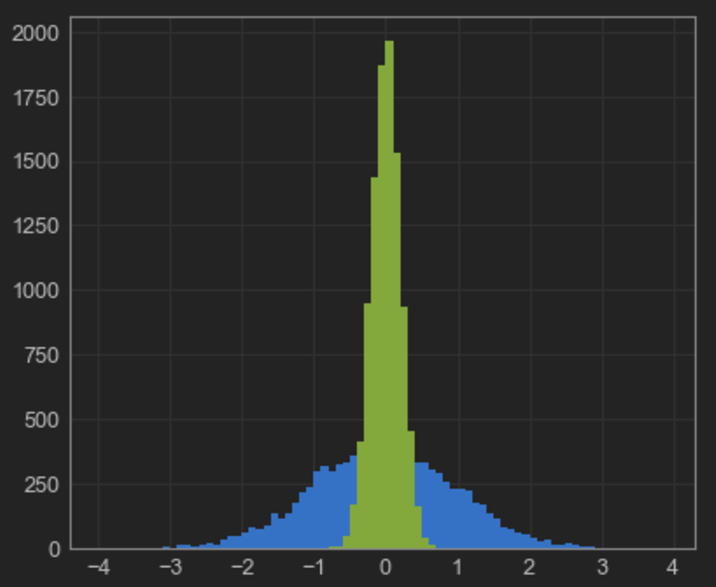
}).plot(kind='hist', bins=np.arange(-4, 4, 0.1))更进一步,plotly允许通过cufflinks模块直接与pandas接口,该模块允许执行以下操作:
pd.DataFrame({
    'firstHistogram': np.random.randn(10000),
    'secondHistogram': 0.2 * np.random.randn(10000)
}).iplot(kind='hist', bins=100)
但是这里有一个问题:cufflinks提供的cufflinks方法似乎不接受bins的列表。如果提供了一个数字,如上面的示例所示,该数字将用于独立地存放两个数据集,这将导致不平等的双值化,从而可能产生误导性结果(请参阅上面的图中的等高)。
虽然使用histnorm='density'选项可以稍微减轻这种影响,但人们可能希望看到每个bin的计数,而不是一个密度。
有办法绕道吗?
回答 2
Stack Overflow用户
发布于 2017-08-21 04:24:55
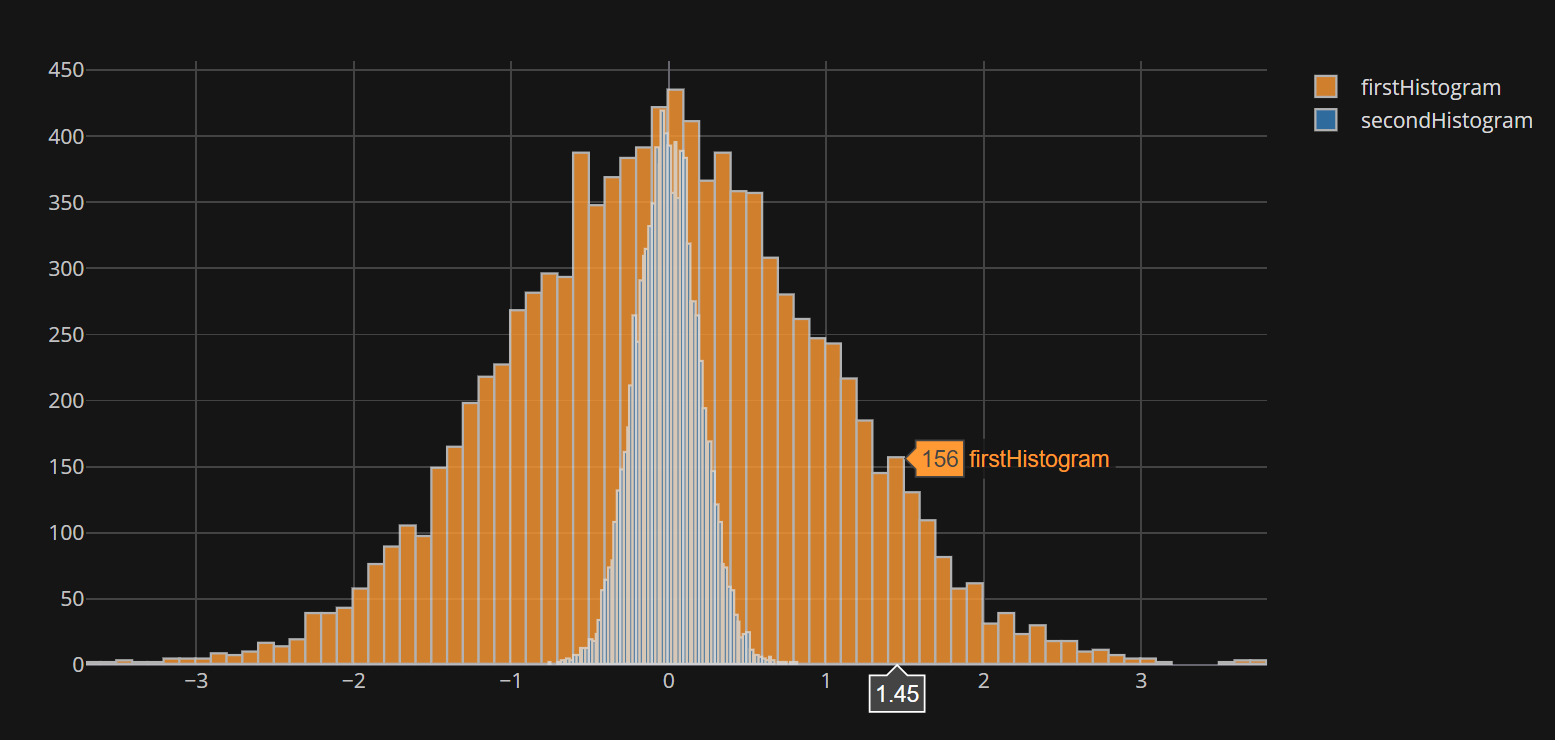
我已经增加了这方面的更新。现在您应该可以指定bins=(start,end,size)了
pd.DataFrame({
'firstHistogram': np.random.randn(10000),
'secondHistogram': 0.2 * np.random.randn(10000)}).iplot(kind='hist',bins=(-4,4,.08))现在应该返回:定制垃圾箱
Stack Overflow用户
发布于 2017-08-20 20:06:41
据我所知,在袖扣中没有直接的方法。在我看来,代码中显示的输出是错误的,也就是说,我认为这是袖扣中的一个错误。
但是你可以很容易地用几行代码来模仿袖扣函数。您可以使用cufflinks.getLayout()获得相同的布局,只需将barmode设置为overlay即可。
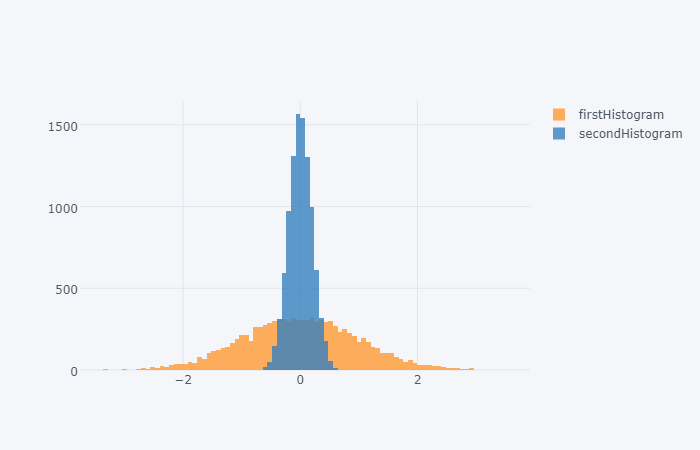
import pandas as pd
import plotly
import cufflinks

plotly.offline.init_notebook_mode()

pd.DataFrame({
    'firstHistogram': np.random.randn(10000),
    'secondHistogram': 0.2 * np.random.randn(10000)
})

data = list()

for dd in df:
    histo = plotly.graph_objs.Histogram(x=df[dd],
                                        name=dd,
                                        xbins={'start': -4, 'end': 4, 'size': 0.08},
                                        autobinx=False,
                                        opacity=0.8
                                       )
    data.append(histo)
layout = plotly.graph_objs.Layout(cufflinks.getLayout(),
                                  barmode='overlay')
fig = plotly.graph_objs.Figure(data=data,
                               layout=layout)
plotly.offline.iplot(fig)https://stackoverflow.com/questions/45784591
复制相似问题
腾讯云开发者

Copyright © 2013 - 2026 Tencent Cloud. All Rights Reserved. 腾讯云 版权所有
深圳市腾讯计算机系统有限公司 ICP备案/许可证号:粤B2-20090059 ![]() 粤公网安备44030502008569号
粤公网安备44030502008569号
腾讯云计算(北京)有限责任公司 京ICP证150476号 | 京ICP备11018762号