
高图图问题
高图图问题
提问于 2017-08-10 14:31:12
我正在尝试使用高级图表来显示从数据库中获得的数据。我把数据推送到这样的系列中:
var seriesDemo = {x: data[i]["fld_DateTime"], y:data[i]["fld_ConsumptionValue"] * 1, deviceType: data[i]["fld_DivisionId"]};
series[newSeriesIndex]["data"].push(seriesDemo);

x_axis = { categories: ["00:00", "01:00", "02:00", "03:00", "04:00", "05:00", "06:00", "07:00", "08:00", "09:00", "10:00", "11:00", "12:00", "13:00", "14:00", "15:00", "16:00", "17:00", "18:00", "19:00", "20:00", "21:00", "22:00", "23:00"] };


var info = {
        chart: {
            type: 'spline',
            renderTo: divInfo,
            zoomType: 'x'
        },
        title: {
            text: title,
            x: -20
        },
        subtitle: {
            text: "",
            x: -20
        },
        xAxis: x_axis,
        yAxis: {
            title: {
                text: ''
            },
            plotLines: [{
                value: 0,
                width: 1,
                color: '#808080'
            }]
        },
        tooltip: {
            shared: true,
            useHTML: true,
            pointFormatter: function() {
                    return this.series.name + ' : <b>' + this.y + '</b> ' + UNIT_TYPE[this.deviceType] + '<br/>' +
                    localize("em_consumption_comparison_report_price") + ' : <b>' + (this.y * UNIT_PRICE_ARRAY[this.deviceType]).toFixed(2) + '</b> ' + MONEY_UNIT_ARRAY[this.deviceType] + '<br/><br/>';
              },

            //xDateFormat: '%Y-%m-%d %H:%M:%S'
        },
        legend: {
            borderWidth: 0
        },
        series: series
    };
    var chart = new Highcharts.Chart(info);
控制台中没有任何错误/警告,但在下面的照片中没有显示任何图表。
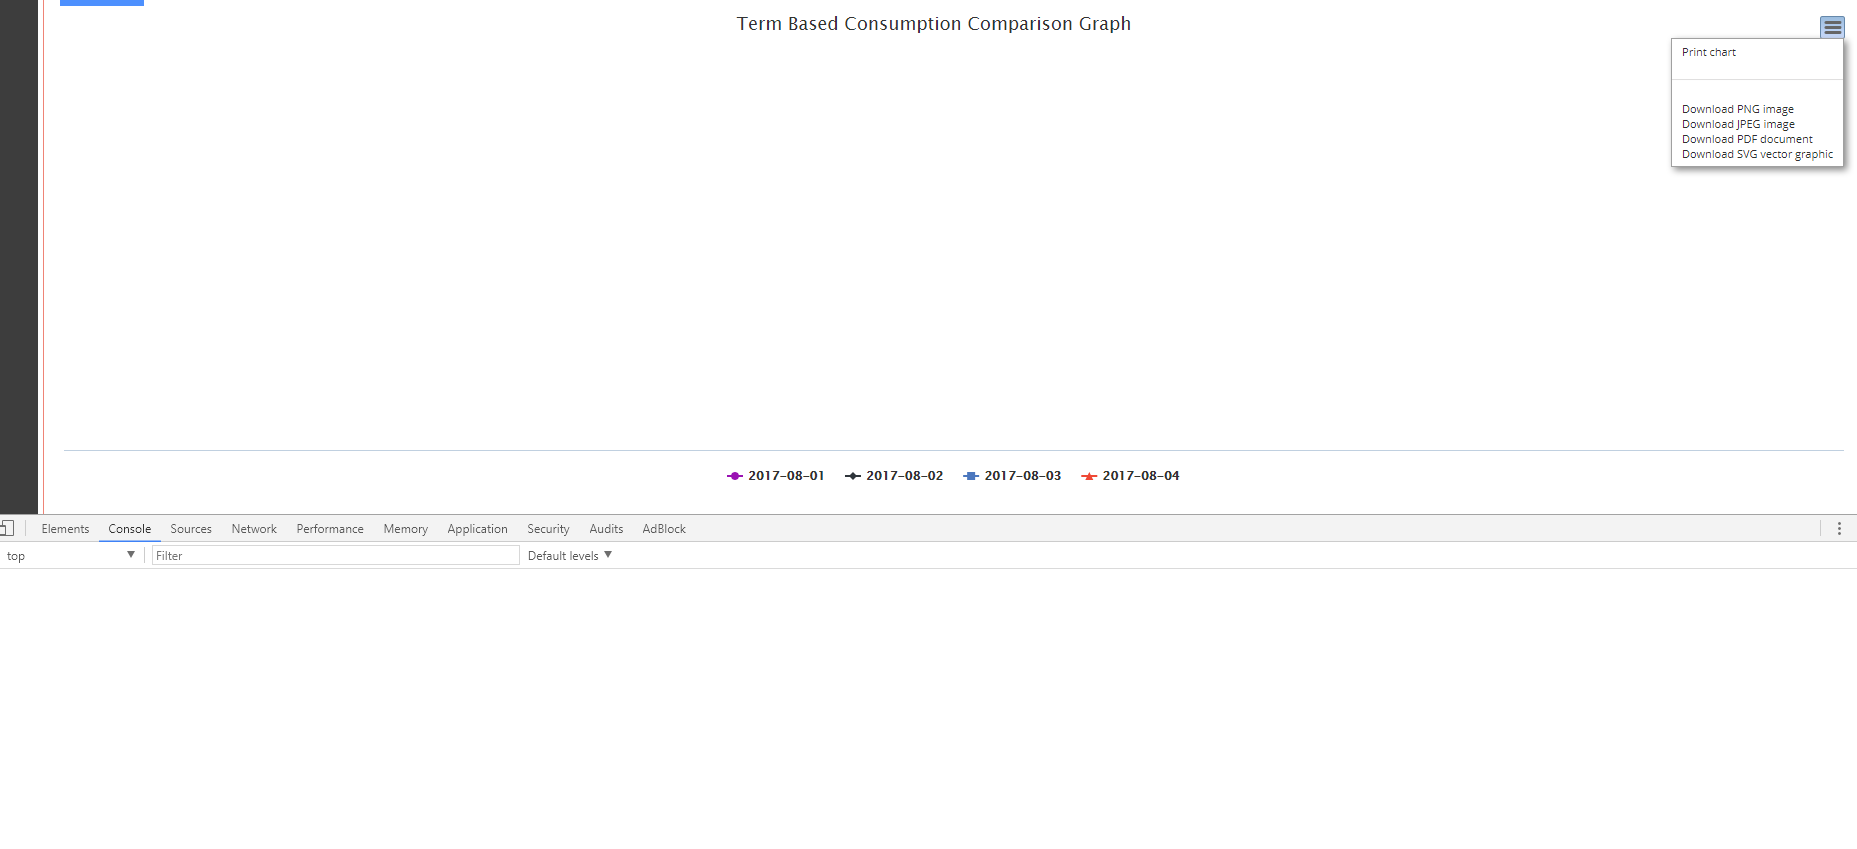
有数据和格式似乎不错。我的数据数组的输出(我可以从控制台看到如下所示):
0:{x: "  00:00", y: 328.52, deviceType: 0}
1:{x: "  01:00", y: 640.04, deviceType: 0}
2:{x: "  02:00", y: 736.9,  deviceType: 0}
3:{x: "  03:00", y: 621.68, deviceType: 0}
4:{x: "  04:00", y: 565.82, deviceType: 0}
5:{x: "  05:00", y: 170.12, deviceType: 0}
 ....................................
 ....................................
23:{x: "  23:00", y: 196.12, deviceType: 0}
有人能看到这里的问题吗?
回答 1
Stack Overflow用户
回答已采纳
发布于 2017-08-10 14:51:29
您的数据的x属性都有前导空格,因此高级图表不能将它们与categories数组中的值相关联。
移除前导空格或将x属性映射到categories数组的相应索引(因此x: "00:00"为x: 0,x: "01:00"为x: 1,等等)。
页面原文内容由Stack Overflow提供。腾讯云小微IT领域专用引擎提供翻译支持
原文链接:
https://stackoverflow.com/questions/45616582
复制相关文章
相似问题
腾讯云开发者

Copyright © 2013 - 2026 Tencent Cloud. All Rights Reserved. 腾讯云 版权所有
深圳市腾讯计算机系统有限公司 ICP备案/许可证号:粤B2-20090059 ![]() 粤公网安备44030502008569号
粤公网安备44030502008569号
腾讯云计算(北京)有限责任公司 京ICP证150476号 | 京ICP备11018762号