
图不调整大小以适应页面
图不调整大小以适应页面
提问于 2017-07-19 13:24:32
这是我的代码:
library(shiny)
library(ggplot2)
library(ggiraph)

df <- data.frame(achseX = LETTERS[1:24], achseY = 1:24, facetX = as.factor(rep(1:4, each = 6)))

server <- function(input, output) {
  output$ggplot <- renderPlot({
    ggplot(data = df) + geom_bar_interactive(aes(tooltip = achseY, x = achseX, y = achseY), stat = "identity") +
      theme_minimal() + facet_grid(.~ facetX, scales = "free_x")
  })


  output$plot <- renderggiraph({
    gg <- ggplot(data = df) + geom_bar_interactive(aes(tooltip = achseY, x = achseX, y = achseY), stat = "identity") +
      theme_minimal() + facet_grid(.~ facetX, scales = "free_x")
    return(ggiraph(code = print(gg), selection_type = "multiple", zoom_max = 4,
                   hover_css = "fill:#FF3333;stroke:black;cursor:pointer;",
                   selected_css = "fill:#FF3333;stroke:black;"))
  })
}

ui <- fluidPage(
  "GGPLOT2:",
  plotOutput("ggplot"),
  "GGIRAPH:",
  ggiraphOutput("plot", width = "500px", height = "1000px")
)

shinyApp(ui = ui, server = server)
结果如下:
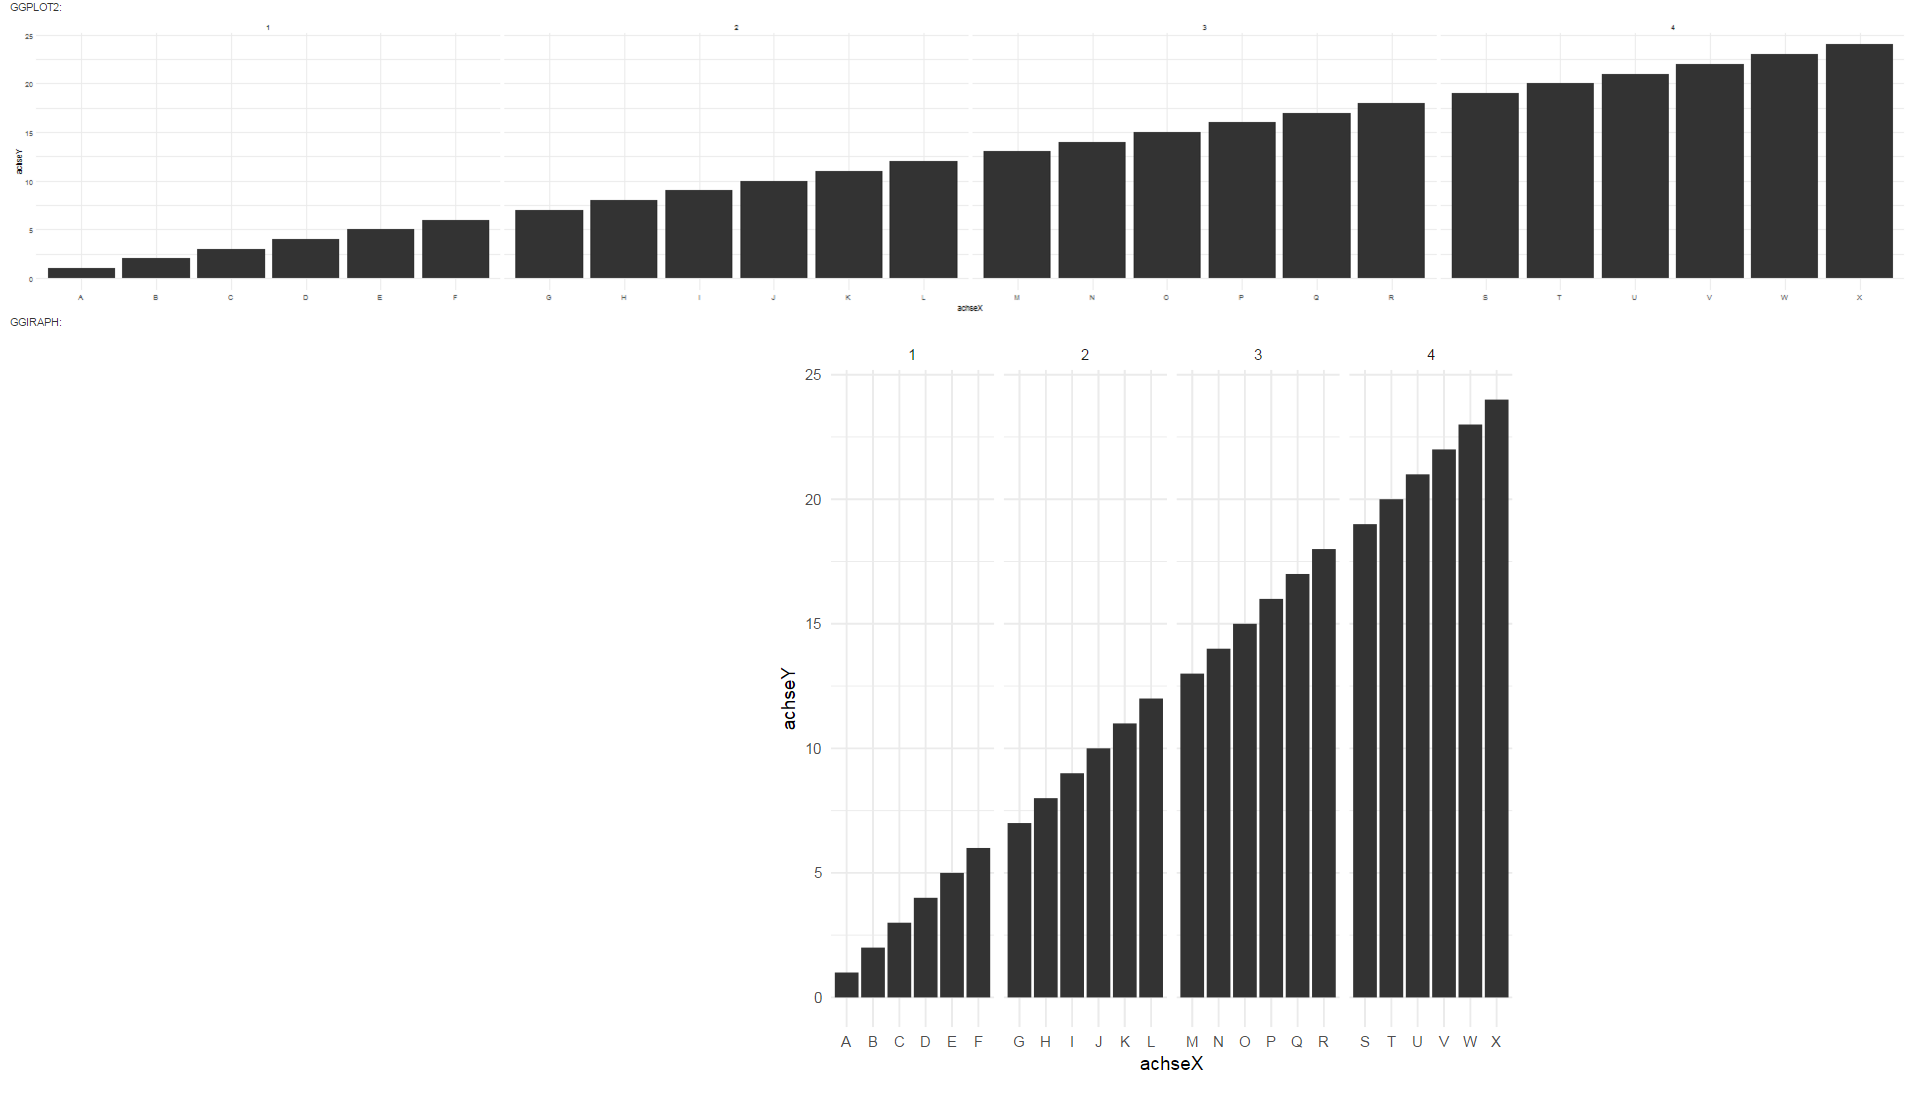
正如您在代码中所看到的那样,第一个barplot是一个ggplot,它以其应有的方式工作。它响应于网站,并具有矩形格式。ggiraph保持正方形格式,不适合页面。
我怎么才能让这个计时器看起来像个眼镜蛇呢?
我尝试了几个宽度和高度参数的组合,也包括width = "auto"和height = "auto"。这使得ggi相图符合页面,但仍然是正方形格式。
回答 2
Stack Overflow用户
回答已采纳
发布于 2017-09-15 10:22:13
Stack Overflow用户
发布于 2017-08-02 13:57:35
您可以通过在ui中使用一定数量的js代码来使ui响应。类似于this答案的东西。
不同的是,ggiraph函数希望输入以英寸为单位,因此我们需要将像素转换为英寸。它的公式是inches = pixels/dpi。因此,ui中的js代码传递窗口高度,以及屏幕的dpi,从中我们可以计算长度(以英寸为单位),然后可以传递给ggiraph函数,从而使绘图响应ui。
我已经修改了你的例子来做到这一点。希望能帮上忙!
 library(shiny)
 library(ggplot2)
 library(ggiraph)

 df <- data.frame(achseX = LETTERS[1:24], achseY = 1:24, facetX = as.factor(rep(1:4, each = 6)))

 server <- function(input, output, session) {
   output$ggplot <- renderPlot({
     ggplot(data = df) + geom_bar_interactive(aes(tooltip = achseY, x = achseX, y = achseY), stat = "identity") +
       theme_minimal() + facet_grid(.~ facetX, scales = "free_x")
   })


   output$plot <- renderggiraph({
     gg <- ggplot(data = df) + geom_bar_interactive(aes(tooltip = achseY, x = achseX, y = achseY), stat = "identity") +
       theme_minimal() + facet_grid(.~ facetX, scales = "free_x")
     return(ggiraph(code = print(gg), selection_type = "multiple", zoom_max = 4,
                    hover_css = "fill:#FF3333;stroke:black;cursor:pointer;",
                    selected_css = "fill:#FF3333;stroke:black;",
                    width_svg = (0.8*input$pltChange$width/input$pltChange$dpi),
                    height_svg = (0.5*input$pltChange$height/input$pltChange$dpi)
                    ))
   })
 }

 ui <- fluidPage(

   tags$body(tags$div(id="ppitest", style="width:1in;visible:hidden;padding:0px")),

   tags$script('$(document).on("shiny:connected", function(e) {
                                    var w = window.innerWidth;
                                    var h = window.innerHeight;
                                    var d =  document.getElementById("ppitest").offsetWidth;
                                    var obj = {width: w, height: h, dpi: d};
                                    Shiny.onInputChange("pltChange", obj);
                                });
                                $(window).resize(function(e) {
                                    var w = $(this).width();
                                    var h = $(this).height();
                                    var d =  document.getElementById("ppitest").offsetWidth;
                                    var obj = {width: w, height: h, dpi: d};
                                    Shiny.onInputChange("pltChange", obj);
                                });
                            '),


   "GGPLOT2:",
   plotOutput("ggplot"),
   "GGIRAPH:",
   ggiraphOutput("plot")
 )

shinyApp(ui = ui, server = server) 页面原文内容由Stack Overflow提供。腾讯云小微IT领域专用引擎提供翻译支持
原文链接:
https://stackoverflow.com/questions/45191999
复制相关文章
相似问题
腾讯云开发者

Copyright © 2013 - 2026 Tencent Cloud. All Rights Reserved. 腾讯云 版权所有
深圳市腾讯计算机系统有限公司 ICP备案/许可证号:粤B2-20090059 ![]() 粤公网安备44030502008569号
粤公网安备44030502008569号
腾讯云计算(北京)有限责任公司 京ICP证150476号 | 京ICP备11018762号