
Geom_smooth:当组添加时,迭代次数超过50次?
Geom_smooth:当组添加时,迭代次数超过50次?
提问于 2017-06-21 14:00:14
我在模特方面很新。我有三组数据(通过period),我想通过散点图上的线条来显示这些数据。
我想出了如何将我的方法和公式放在geom_smooth中,并且我能够显示一行。
但是,当我想要添加每个组的行(这可以由ggplot(.., aes(..,group = period))完成)时,我得到了一个警告:
Warning message:
Computation failed in `stat_smooth()`:
number of iterations exceeded maximum of 50
并没有显示这条线。
我的工作代码:
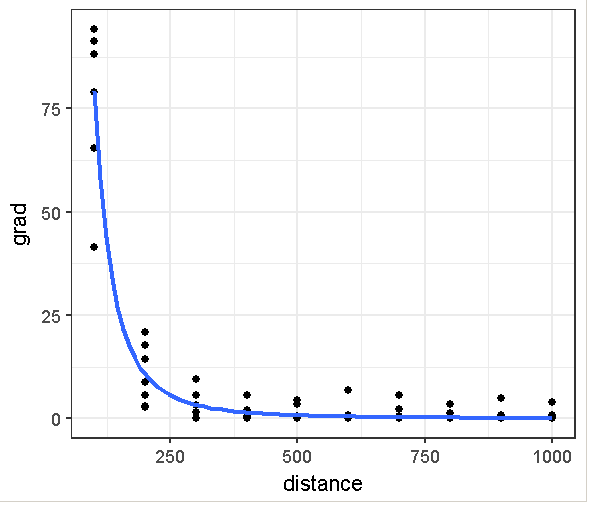
ggplot(tab, aes(x=distance, y=grad)) + #
  geom_point() + theme_bw() +
  geom_smooth(method = "nls",
              formula = y ~ a*x^(-b),
              method.args = list(start=c(a=20, b=0.01)),  #
              se = F)
结果:
提供错误的代码(在group = period中添加了aes),并且不显示每个组的行:
ggplot(tab, aes(x=distance, y=grad, group = period)) + #
  geom_point() + theme_bw() +
  geom_smooth(method = "nls",
              formula = y ~ a*x^(-b),
              method.args = list(start=c(a=20, b=0.01)),  #
se = F)您有什么想法吗?如何通过ggplot2函数在geom_smooth中增加迭代次数?我发现了一些信息来增加control=nls.control(maxiter=200) https://stat.ethz.ch/pipermail/r-help/2006-June/107606.html相对于R基建模的迭代次数,但是我找不到ggplot2的解决方案或方向。
回答 1
Stack Overflow用户
回答已采纳
发布于 2017-06-27 07:42:09
基于@Axeman注释,我将control=nls.control(maxiter=200)添加到
method.args = list(start=c(a=20, b=0.01),
                                 control=nls.control(maxiter=200))
因此,整个剧本是:
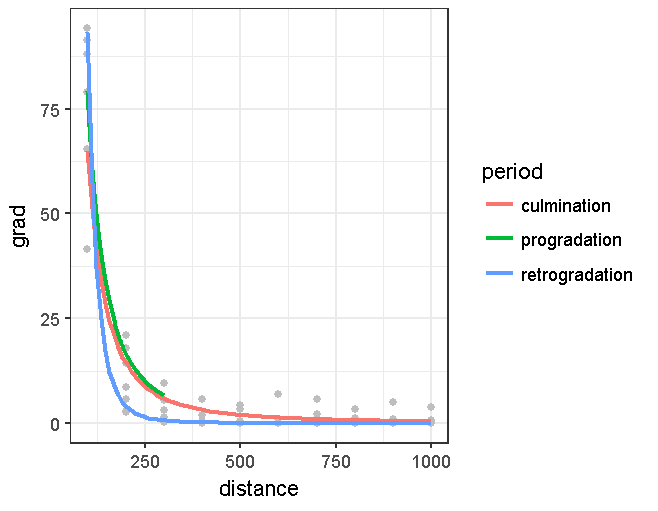
ggplot(tab, aes(x=distance, y=grad, group = period, col = period)) + #
  geom_point(col = "grey") + theme_bw() +
  geom_smooth(method = "nls",
              formula = y ~ a*x^(-b),
              method.args = list(start=c(a=20, b=0.01),
                                 control=nls.control(maxiter=200)),  #
              se = F)
结果是:
页面原文内容由Stack Overflow提供。腾讯云小微IT领域专用引擎提供翻译支持
原文链接:
https://stackoverflow.com/questions/44678299
复制相关文章
相似问题
腾讯云开发者

Copyright © 2013 - 2026 Tencent Cloud. All Rights Reserved. 腾讯云 版权所有
深圳市腾讯计算机系统有限公司 ICP备案/许可证号:粤B2-20090059 ![]() 粤公网安备44030502008569号
粤公网安备44030502008569号
腾讯云计算(北京)有限责任公司 京ICP证150476号 | 京ICP备11018762号