
图间固定比例色条的ggplot2热图
图间固定比例色条的ggplot2热图
提问于 2017-06-20 14:23:20
我需要画三个不同的情节设置相同的比例范围颜色。我有3个不同取值范围的矩阵。
例如:
range(matrixA)
# 0.60 0.85
range(matrixB)
# 0.65 0.95
range(matrixA)
# 0.5 1.0
我想用同样的颜色填充情节。例如,对于差分图中的所有0.8值,如果在第一个图中为0.8橙色,我希望不同图中的所有0.8值都是相同的橙色。
我现在的问题是:
在第一幅图中,最大值的颜色是红色,然后0.85是红色。
在第二幅图中,最大值为红色,但在这种情况下,最大值为0.95,出现了问题。
我的代码:
mat.melted <- melt(matrixA)
colnames(mat.melted) <- c("p","c","v")
p <- ggplot(mat.melted, aes(x=c,y=p,fill=v) +
         geom-tile() +
         scale_fill_gradintn(limits = c(min(as.vector(matrixA)), max(as.vector(matrixA))),
colors = c("yellow","orange","red"))回答 1
Stack Overflow用户
回答已采纳
发布于 2017-06-20 14:49:59
您需要为所有这些设置相同的范围(颜色条的限制),并指定颜色。
rng = range(matrixA, matrixB, matrixC)并将其添加到ggplot代码中:
g + scale_fill_gradient2(low="green", mid="lightblue", high="red", #colors in the scale
               midpoint=mean(rng),    #same midpoint for plots (mean of the range)
               breaks=seq(0,1,0.25), #breaks in the scale bar
               limits=c(floor(rng[1]), ceiling(rng[2])))
示例:
下面是一个帮助您获得所需内容的示例:
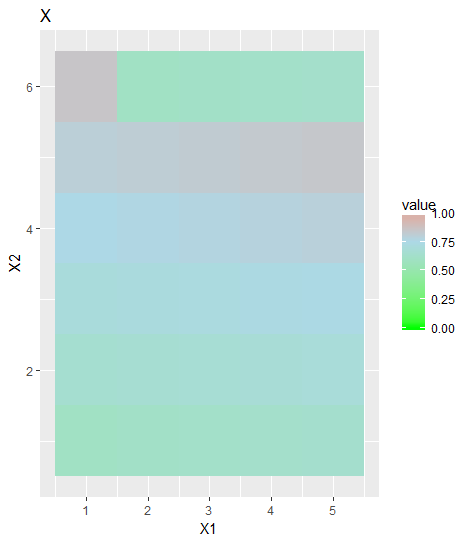
x <- matrix(60:85, 5)/100
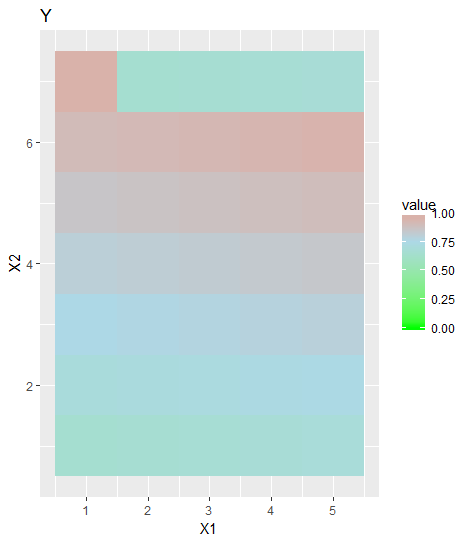
y <- matrix(65:95, 5)/100
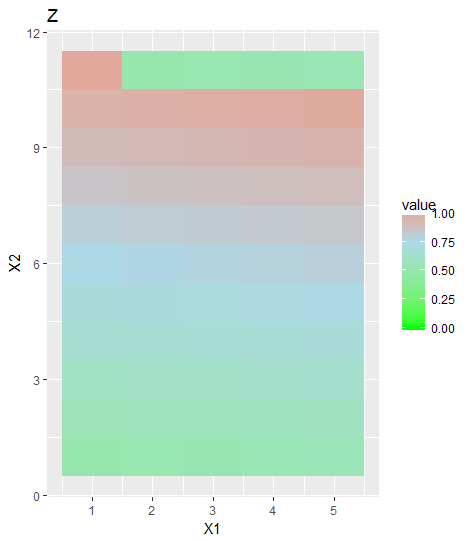
z <- matrix(50:100, 5)/100
rng = range(c((x), (y), (z)))
library(reshape)
library(ggplot2)
ggplot(data = melt(x)) + geom_tile(aes(x=X1,y=X2,fill = value)) +
scale_fill_gradient2(low="green", mid="lightblue", high="red", #colors in the scale
midpoint=mean(rng), #same midpoint for plots (mean of the range)
breaks=seq(0,1,0.25), #breaks in the scale bar
limits=c(floor(rng[1]), ceiling(rng[2]))) + #same limits for plots
ggtitle("X")
ggplot(data = melt(y)) + geom_tile(aes(x=X1,y=X2,fill = value)) +
scale_fill_gradient2(low="green", mid="lightblue", high="red",
midpoint=mean(rng),
breaks=seq(0,1,0.25),
limits=c(floor(rng[1]), ceiling(rng[2]))) +
ggtitle("Y")
ggplot(data = melt(z)) + geom_tile(aes(x=X1,y=X2,fill = value)) +
scale_fill_gradient2(low="green", mid="lightblue", high="red",
midpoint=mean(rng),
breaks=seq(0,1,0.25),
limits=c(floor(rng[1]), ceiling(rng[2]))) +
ggtitle("Z") 这将给你:
页面原文内容由Stack Overflow提供。腾讯云小微IT领域专用引擎提供翻译支持
原文链接:
https://stackoverflow.com/questions/44655723
复制相关文章
相似问题
腾讯云开发者

Copyright © 2013 - 2026 Tencent Cloud. All Rights Reserved. 腾讯云 版权所有
深圳市腾讯计算机系统有限公司 ICP备案/许可证号:粤B2-20090059 ![]() 粤公网安备44030502008569号
粤公网安备44030502008569号
腾讯云计算(北京)有限责任公司 京ICP证150476号 | 京ICP备11018762号