
使用河图的r Sankey图.垂直标签
使用河图的r Sankey图.垂直标签
提问于 2017-06-15 18:39:12
我正在使用R中的riverplot包,我能够制作一个Sankey图。我希望能够添加一个垂直标签(最好在底部)。我找到了一个这样做的例子:http://www.statsmapsnpix.com/2016/08/research-with-qgis-r-and-speaking-to.html (我指的是图20,靠近2004和2015这样的顶级标签,我正试图找出如何创建)。
我怎么才能自己做呢?
下面是一个MWE,直接取自https://cran.r-project.org/web/packages/riverplot/riverplot.pdf的包文档
library(riverplot)
nodes <- c( LETTERS[1:3] )
edges <- list( A= list( C= 10 ), B= list( C= 10 ) )
r <- makeRiver( nodes, edges, node_xpos= c( 1,1,2 ),
node_labels= c( A= "Node A", B= "Node B", C= "Node C" ),
node_styles= list( A= list( col= "yellow" )) )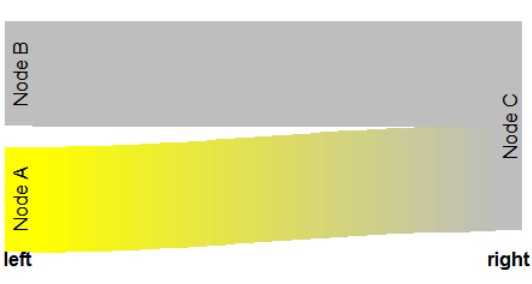
plot( r )在这里,我希望在Node A和Node B下面有一个名为Left的标签,在Node C下有另一个标签叫做Right。
回答 1
Stack Overflow用户
回答已采纳
发布于 2017-06-15 19:46:24
有一种方法可以做到:
library(riverplot)
nodes <- c( LETTERS[1:3] )
edges <- list( A= list( C= 10 ), B= list( C= 10 ) )
r <- makeRiver( nodes, edges, node_xpos= c( 1,1,2 ),
node_labels= c( A= "Node A", B= "Node B", C= "Node C" ),
node_styles= list( A= list( col= "yellow" )) )
(coords <- plot(r))
#          A   B   C
# x        1   1   2
# top    -22 -10 -20
# center -17  -5 -10
# bottom -12   0   0
text(
  x = range(coords["x",]),
  y = min(coords["top",]),
  labels = c("left", "right"),
  pos = 1, offset = 0, font = 2
)
页面原文内容由Stack Overflow提供。腾讯云小微IT领域专用引擎提供翻译支持
原文链接:
https://stackoverflow.com/questions/44574652
复制相关文章
相似问题
腾讯云开发者

Copyright © 2013 - 2026 Tencent Cloud. All Rights Reserved. 腾讯云 版权所有
深圳市腾讯计算机系统有限公司 ICP备案/许可证号:粤B2-20090059 ![]() 粤公网安备44030502008569号
粤公网安备44030502008569号
腾讯云计算(北京)有限责任公司 京ICP证150476号 | 京ICP备11018762号