
河网中的排序节点
河网中的排序节点
提问于 2017-06-07 05:31:42
我目前正在开发一个riverplot图,其中包含了江河绘图包。然而,我很难得到关于这个情节的数据。让我以一个例子来解释:
library(riverplot)
df.nodes <- cbind.data.frame(c("A", "B", "C", "D", "E", "F", "G", "H","I","K"), c(1,1,1,1,2,2,2,2,3,3))
colnames(df.nodes) <- c("ID", "x")
df.edges <- cbind.data.frame(c("A", "B", "C", "D", "E", "F", "G", "H"), c("G", "H", "E", "F", "K", "K","I","I"), rep(1, 8))
colnames(df.edges) <- c("N1", "N2", "Value")
ex.river <- makeRiver(df.nodes, df.edges)
plot(ex.river)
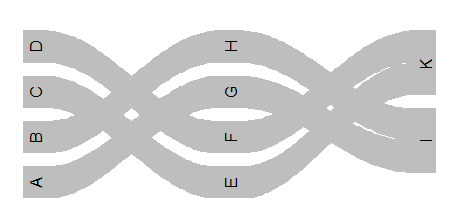
正如你所看到的,这个例子中的边缘互相交叉。当您有更多的节点时,这会变得非常混乱,而不是在我的示例中。我的问题是:你有什么创造性的想法,如何排序节点,我得到这样的东西:(这不是一个代码,但输出的顺序,我想要的)
D   F
C   E   K
B   H   I
A G边缘应该尽可能地互相交叉。据我所知,df.nodes定义了节点的顺序,因此我应该以某种方式重新排序df.nodes。当然,我可以手动订购df.nodes,但是如果您有很多节点,就会变得很棘手。
任何想法都是非常感谢的。
回答 1
Stack Overflow用户
回答已采纳
发布于 2017-06-09 08:25:43
这是一个棘手的问题,它需要使用data.table进行大量的连接操作。可能有更聪明的解决方案。但是,这个方法适用于给定的数据集。
基本思想是从左到右对节点和边进行排序。
数据
df.nodes <- data.frame(ID = c("A", "B", "C", "D", "E", "F", "G", "H","I","K"),
                       x  = c(rep(1:2, each = 4L), 3L, 3L),
                       stringsAsFactors = FALSE)
df.edges <- data.frame(N1 = c("A", "B", "C", "D", "E", "F", "G", "H"),
                       N2 = c("G", "H", "E", "F", "K", "K","I","I"),
                       Value = rep(1L, 8),
                       stringsAsFactors = FALSE)

library(data.table)   # CRAN version 1.10.4 used
# coerce to data.table and use abbreviated object names
edt <- setDT(df.edges)
ndt <- setDT(df.nodes)
获取边缘位置
# add x positions of nodes to edges
# two joins required for each of the two nodes of an edge
edt2 <- ndt[ndt[edt, on = c(ID = "N2")], on = c(ID = "N1")][
  , setnames(.SD, c("N1", "x1", "N2", "x2", "Value"))]
# add unique id number for edge x-positions from left to right
# id reflects order of x pos 1-2, 2-3, ..., 10-11
edt2[order(x1, x2), e.pos := rleid(x1, x2)]
edt2
#   N1 x1 N2 x2 Value e.pos
#1:  A  1  G  2     1     1
#2:  B  1  H  2     1     1
#3:  C  1  E  2     1     1
#4:  D  1  F  2     1     1
#5:  E  2  K  3     1     2
#6:  F  2  K  3     1     2
#7:  G  2  I  3     1     2
#8:  H  2  I  3     1     2
从左到右排序
# initialize: get order of nodes in leftmost x position
# update edt2 with row number
edt2 <- ndt[x == 1L, .(N1 = ID, rn1 = .I)][edt2, on = "N1"]
# loop over edge positions
# determine row numbers (sort order) for nodes from left to right
for (p in edt2[, head(unique(e.pos), -1L)]) {
  edt2[p == e.pos, rn2 := rn1]
  edt2 <- edt2[p == e.pos, .(N1 = N2, rn1 = rn2)][edt2, on = "N1"]
  edt2[, rn1 := dplyr::coalesce(rn1, i.rn1)][, i.rn1 := NULL]
}
edt2[e.pos == last(e.pos), rn2 := rn1]
edt2
#   N1 rn1 x1 N2 x2 Value e.pos rn2
#1:  A   1  1  G  2     1     1   1
#2:  B   2  1  H  2     1     1   2
#3:  C   3  1  E  2     1     1   3
#4:  D   4  1  F  2     1     1   4
#5:  E   3  2  K  3     1     2   3
#6:  F   4  2  K  3     1     2   4
#7:  G   1  2  I  3     1     2   1
#8:  H   2  2  I  3     1     2   2
从边缘表中提取节点排序顺序
# extract sort order of all nodes from edge table,
# update node table
ndt <- unique(edt2[, .(ID = c(N1, N2), rn = c(rn1, rn2))], by = "ID")[ndt, on = "ID"]
ndt
#    ID rn x
# 1:  A  1 1
# 2:  B  2 1
# 3:  C  3 1
# 4:  D  4 1
# 5:  E  3 2
# 6:  F  4 2
# 7:  G  1 2
# 8:  H  2 2
# 9:  I  1 3
#10:  K  3 3
创建河面
library(riverplot)
# pass sorted node table
# coercion back to data.frame required due to type check in `makeRiver()`
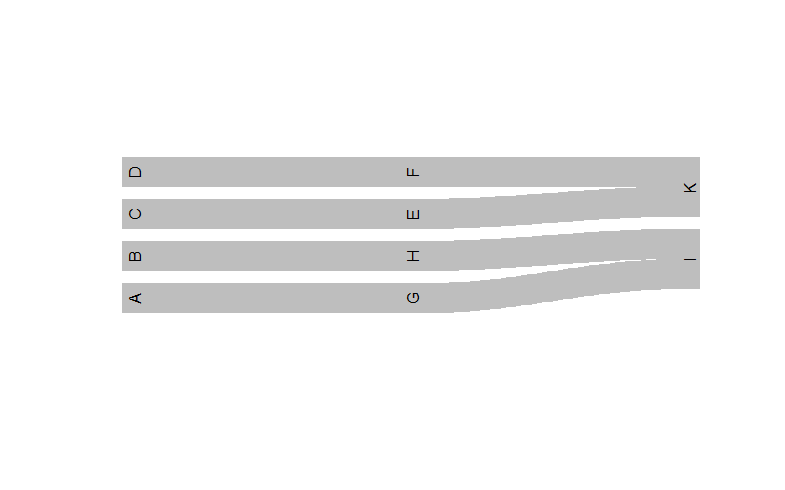
ex.river <- makeRiver(setDF(ndt[order(x, rn), .(ID, x)]), setDF(edt))
plot(ex.river)
页面原文内容由Stack Overflow提供。腾讯云小微IT领域专用引擎提供翻译支持
原文链接:
https://stackoverflow.com/questions/44404258
复制相关文章
相似问题
腾讯云开发者

Copyright © 2013 - 2026 Tencent Cloud. All Rights Reserved. 腾讯云 版权所有
深圳市腾讯计算机系统有限公司 ICP备案/许可证号:粤B2-20090059 ![]() 粤公网安备44030502008569号
粤公网安备44030502008569号
腾讯云计算(北京)有限责任公司 京ICP证150476号 | 京ICP备11018762号