
如何找到R中“`dotchart`”中标签的坐标?
如何找到R中“`dotchart`”中标签的坐标?
提问于 2017-06-03 06:26:23
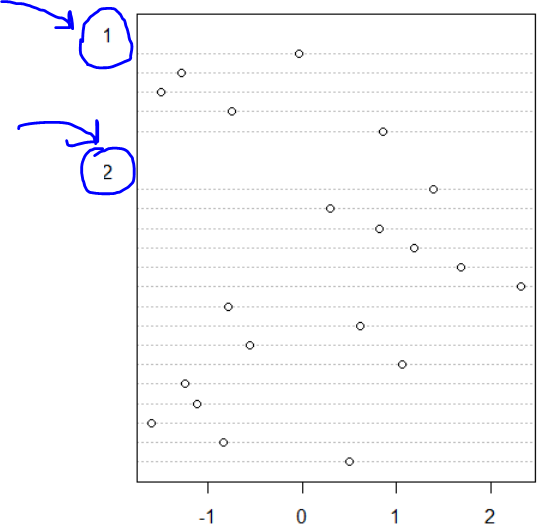
我想知道是否能在R中的标签(如下图中的蓝色圈)中找到dotchart的坐标(即x,y)?
y = rnorm(20)

groups = factor( rep(1:2, times = c(5, 15) ) )

dotchart(y, groups = groups)
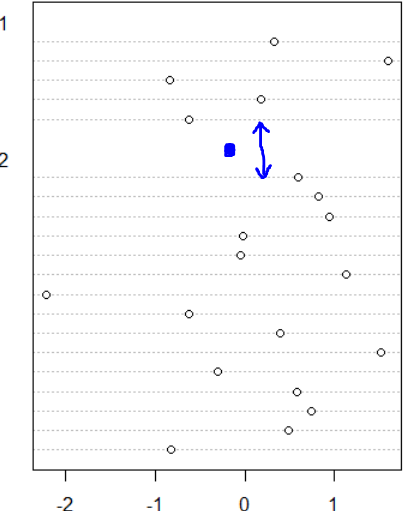
Update:,我还在问,下面图片中的双头箭头之间的点的y坐标是什么(假设我知道x,但我希望这个点位于双头箭头之间,那么y是什么,这样我就可以在双头箭头之间的区域中放置点):
回答 1
Stack Overflow用户
回答已采纳
发布于 2017-06-03 10:31:11
查看dotchart函数内部,可以看到组标签是使用mtext编写的。
mtext(glabels, side = 2, line = goffset, at = gpos, adj = 0,
col = "red", las = 2, cex = 1)其中gpos是由以下方法计算的组标签位置的矢量:
gpos <- rev(cumsum(rev(tapply(groups, groups, length)) + 2) - 1)

#########
1  2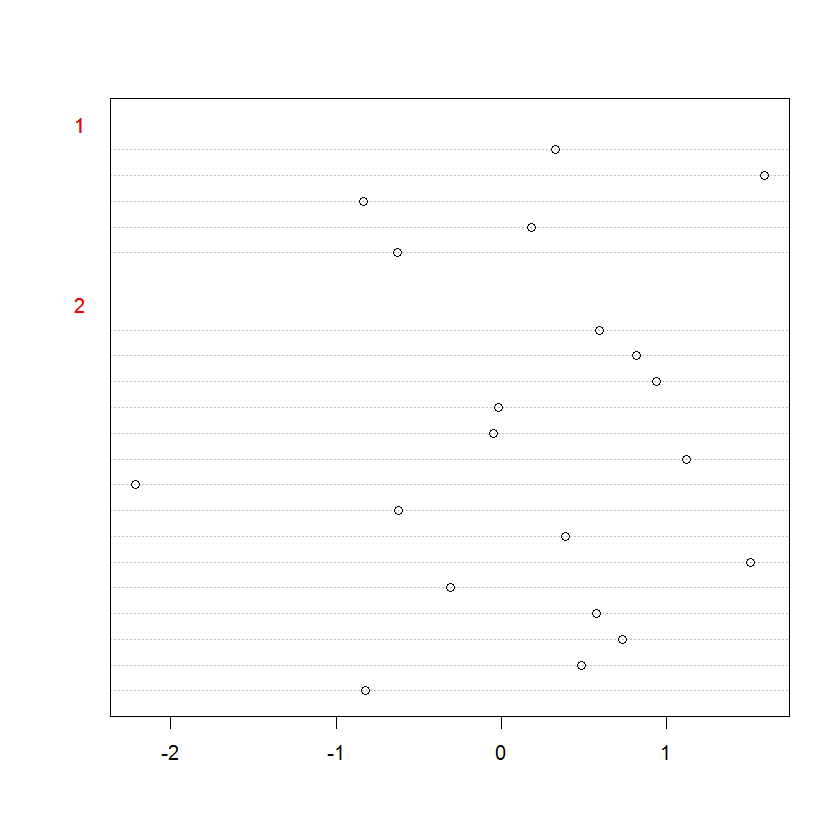
23 16下面我们尝试在dotcharts打印的组标签的相同位置(和红色)上打印组标签。
graphics.off()
set.seed(1)
y = rnorm(20)
groups = factor( rep(1:2, times = c(5, 15) ) )
dotchart(y, groups = groups)

glabels <- levels(groups)
linch <- 0
ginch <- max(strwidth(glabels, "inch"), na.rm = TRUE)
goffset <- 0.4
nmai <- par("mai")
nmai[2L] <- nmai[4L] + max(linch + goffset, ginch) + 0.1
par(mai = nmai)
lheight <- par("csi")
gpos <- rev(cumsum(rev(tapply(groups, groups, length)) + 2) - 1)
ginch <- max(strwidth(glabels, "inch"), na.rm = TRUE)
goffset <- (max(linch + 0.2, ginch, na.rm = TRUE) + 0.1)/lheight
mtext(glabels, side = 2, line = goffset, at = gpos, adj = 0,
    col = "red", las = 2, cex = 1)
编辑.
从这个链接下载一个修改过的dotchart版本,并将其保存到您的工作目录中作为mydotchart.r
然后键入以下代码:
source("mydotchart.r")
set.seed(1)
y = rnorm(20)
groups = factor( rep(1:2, times = c(5, 15) ) )
mydotchart(y, groups = groups)函数mydotchart.r提供以下输出:
$gpos
 1  2
23 16

$linepos
[1] 1 2 3 4 5 6 7 8 9 10 11 12 13 14 15 18 19 20 21 22其中gpos是组标签的y位置,linepos是水平虚线灰度线y位置的向量。
使用linepos可以计算出上述问题中双头箭头之间的位置。
希望它能帮到你。
页面原文内容由Stack Overflow提供。腾讯云小微IT领域专用引擎提供翻译支持
原文链接:
https://stackoverflow.com/questions/44341025
复制相关文章
相似问题
腾讯云开发者

Copyright © 2013 - 2026 Tencent Cloud. All Rights Reserved. 腾讯云 版权所有
深圳市腾讯计算机系统有限公司 ICP备案/许可证号:粤B2-20090059 ![]() 粤公网安备44030502008569号
粤公网安备44030502008569号
腾讯云计算(北京)有限责任公司 京ICP证150476号 | 京ICP备11018762号