
带江河绘图包的Sankey地块
带江河绘图包的Sankey地块
提问于 2017-05-18 12:52:30
附魔。
编辑:解决方案
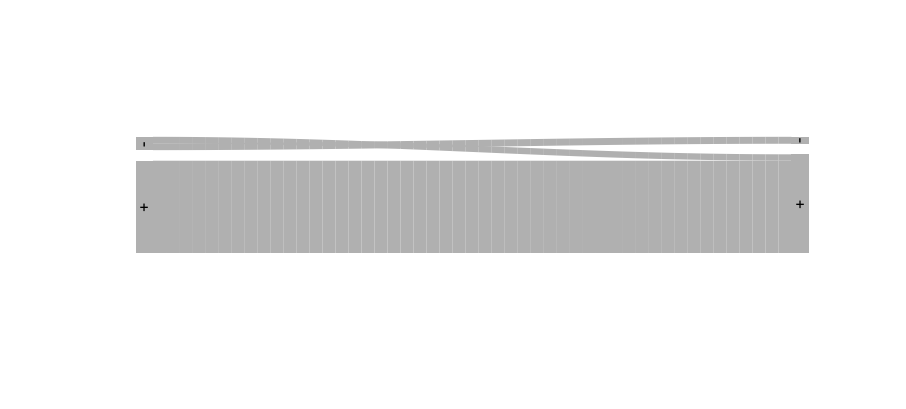
正如MartineJ和emilliman5所指出的,节点应该有唯一的标签(如下所示)。
library("riverplot")
nodes<-structure(list(ID = c("2011+", "2011-", "2016+", "2016-"), x = c(20,
20, 30, 30), y = c(50, 40, 50, 40)), class = "data.frame", row.names = c(NA,
-4L))
edges<-structure(list(N1 = c("2011+", "2011-", "2011+", "2011-"), N2 =
c("2016+", "2016-", "2016-", "2016+"), Value = c(461, 7, 0, 46)), class =
"data.frame", row.names = c(NA, -4L))

river <- makeRiver(nodes,edges)
riverplot(river)我一直在尝试绘制一个Sankey图/江河图(使用河岸包)来描述癌症注册是如何随时间发展的,不过到目前为止,这段代码并没有给我带来什么成功。有人能告诉我这段代码的错误吗?
Warning message: In checkedges(x2$edges, names(x2)) : duplicated edge information, removing 1 edges这是可疑代码:
library(“riverplot”)

edges<-structure(list(N1 = c("+", "-", "+", "-"), N2 = c("+", "-", "-", "+"), Value = c(664L, 50L, 0L, 46L)), .Names = c("N1", "N2", "Value"), class = "data.frame", row.names = c(NA, -4L))

nodes = data.frame(ID = unique(c(edges$N1, edges$N2)), stringsAsFactors = FALSE)

nodes$x = c(1,2)
rownames(nodes) = nodes$ID

rp <- list(nodes=nodes, edges=edges)

class(rp) <- c(class(rp), "riverplot")

plot(rp)
以及包含在代码中的数据:
N1    N2    Value
 +     +     664
 -     -      50
 +     -       0
 -     +      46
永远感激。
回答 2
Stack Overflow用户
回答已采纳
发布于 2017-06-20 14:48:49
您的节点需要唯一命名,然后使用nodes$labels将其更改为:
library(riverplot)

edges<-structure(list(N1 = c("+", "-", "+", "-"), N2 = c("+", "-", "-", "+"), Value = c(664L, 50L, 0L, 46L)), .Names = c("N1", "N2", "Value"), class = "data.frame", row.names = c(NA, -4L))
edges$N1 <- paste0(edges$N1, "a")
edges$N2 <- paste0(edges$N2, "b")
nodes = data.frame(ID = unique(c(edges$N1, edges$N2)), stringsAsFactors = FALSE)

nodes$x = c(1,1,2,2)
nodes$labels <- as.character(substr(nodes$ID, 1, 1))
rownames(nodes) = nodes$ID

rp <- list(nodes=nodes, edges=edges)

class(rp) <- c(class(rp), "riverplot")

plot(rp)
Stack Overflow用户
发布于 2017-06-20 14:38:07
看起来,您在N1 (和N2)中多次使用相同的值。试着使它们都不同(每一栏),然后再试一次,f.i.:
N1: plus1 minus1 plus2 minus2
如果您希望只显示+和-:在makeRiver中,有一个选项**node_labels **
页面原文内容由Stack Overflow提供。腾讯云小微IT领域专用引擎提供翻译支持
原文链接:
https://stackoverflow.com/questions/44048322
复制相关文章
相似问题
腾讯云开发者

Copyright © 2013 - 2026 Tencent Cloud. All Rights Reserved. 腾讯云 版权所有
深圳市腾讯计算机系统有限公司 ICP备案/许可证号:粤B2-20090059 ![]() 粤公网安备44030502008569号
粤公网安备44030502008569号
腾讯云计算(北京)有限责任公司 京ICP证150476号 | 京ICP备11018762号