
matplotlib子图的相对大小
matplotlib子图的相对大小
提问于 2017-05-17 16:47:24
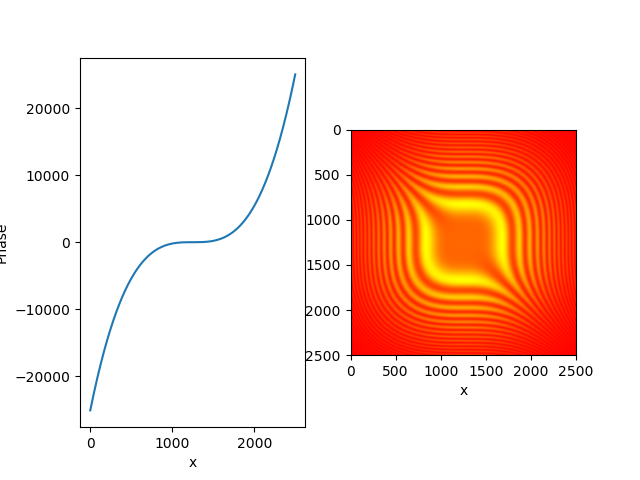
我正在尝试实现生成由子图组成的地块:plt.plot()和plt.matshow(),其中两个地块的大小完全相同。我的意思是,一个地块的下界和第二个地块的下界位于相同的“高度”上。与上边边界线相似。下面的图显示了电流效应。
我还没有在现有的资源中找到任何方法来帮助我达到这一效果。如果你能帮我,我将不胜感激。
shape=(2500, 2500)
matrix=np.zeros(shape)
print "Start of computing"
for x in range(shape[0]) :
  for y in range(shape[1]) :
    matrix[x, y]=shapeFuction((x-shape[0]/2)/13.0, (y-shape[1]/2)/13.0, 2.0e-4, 9e-5, 1.0)

print "Start of plotting"
fig=plt.figure()
ax = fig.add_subplot(1,2,2, aspect=1)
ax.matshow(matrix, cmap="autumn") #data[250:501,150:351])
ax.set(adjustable='datalim', aspect=1)
ax.set_xlabel("x")
ax.set_ylabel("y")
ax.xaxis.set_ticks_position('bottom')
ax.set(adjustable='box-forced') #adjustable='datalim'
ax.grid(b=False)

print "Start of plotting part 2"
ax = fig.add_subplot(1,2,1)
phase=(9.0e-5*np.power(np.arange(0, shape[1])-shape[1]/2,3 ))/7
g=ax.get_ylim()
asp=shape[1]/float(abs(g[0]-g[1]))
ax.plot(phase) #data[250:501,150:351])
ax.set(adjustable='box-forced')#, aspect=1.06/6.0) #adjustable='datalim''box-forced'
ax.set_xlabel("x")
ax.set_ylabel("Phase")
plt.savefig('testData-x3.png')
# plt.show()
回答 1
Stack Overflow用户
回答已采纳
发布于 2017-05-17 17:15:41
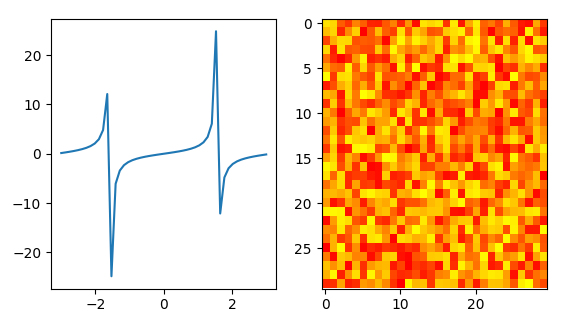
您可以选择的一个选项是将隐显图(通常为1,即像素被平方)的方面设置为"auto",ax2.imshow(z, cmap="autumn", aspect="auto")。
import matplotlib.pyplot as plt
import numpy as np

x = np.linspace(-3,3)
y = np.tan(x)
z = np.random.rand(30,30)

fig, (ax, ax2) = plt.subplots(ncols=2)

ax.plot(x,y)
ax2.imshow(z, cmap="autumn", aspect="auto")

plt.show()
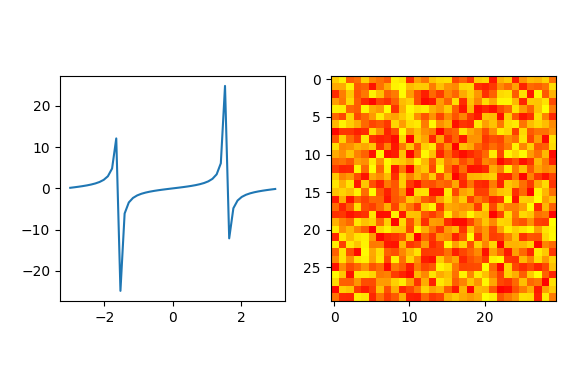
如果您想要保持图像图的纵横比,则可以通过比较不同的轴限值来更改线条图的方向,
import matplotlib.pyplot as plt
import numpy as np

x = np.linspace(-3,3)
y = np.tan(x)
z = np.random.rand(30,30)

fig, (ax, ax2) = plt.subplots(ncols=2)

ax.plot(x,y)
ax2.imshow(z, cmap="autumn")

ratio = np.diff(ax.get_ylim())[0]/np.diff(ax.get_xlim())[0]
ratio2 = np.diff(ax2.get_ylim())[0]/np.diff(ax2.get_xlim())[0]
aspect = ratio2/ratio
ax.set_aspect(float(np.abs(aspect)))

plt.show()
页面原文内容由Stack Overflow提供。腾讯云小微IT领域专用引擎提供翻译支持
原文链接:
https://stackoverflow.com/questions/44030647
复制相关文章
相似问题
腾讯云开发者

Copyright © 2013 - 2026 Tencent Cloud. All Rights Reserved. 腾讯云 版权所有
深圳市腾讯计算机系统有限公司 ICP备案/许可证号:粤B2-20090059 ![]() 粤公网安备44030502008569号
粤公网安备44030502008569号
腾讯云计算(北京)有限责任公司 京ICP证150476号 | 京ICP备11018762号