
如何绘制还包括直线垂直线(如x=2)的函数?
对于我的程序,我尝试有一个悬臂梁的用户输入属性,从他们的输入,程序将输出一个剪切图。我简单地从一个奇异的向下负载开始(用户输入点在梁上发生这种负载和负载值)。我认为分段函数的设置可以工作,下面是我的代码:
length = input("input the length of your beam: ")
load = input("input your load: ")
distl = input("input the distance from the wall where your load starts: ")
distr = input("input the disance from the wall where your load ends: ")

load = float(load)
load = -load

length = int(length)
distl = int(distl)
distr = int(distr)


i = 0
graph = [0, 0, 0, 0, 0, 0, 0, 0, 0, 0, 0]
while i<=length:

    if  distl < i < distr:
            graph[i] = load
    else:
        graph[i] = 0

    i = i +1


plt.ylabel('Shear (V(x))')
plt.xlabel('x (meters)')
plt.plot(graph)
plt.show()这最终输出了下面的图表:在这里输入图像描述
有人能解释一下为什么这包括一个斜坡而不是简单的跳跃吗?谢谢。
回答 2
Stack Overflow用户
发布于 2017-05-11 20:24:37
(更新:)也许你在找matplotlib.pyplot.step(X, Y, ...)
>>> import matplotlib.pyplot as plt
>>> X = range(8)
>>> Y = [2, 2, 3, 3, 4, 4, 2, 2]
>>> plt.step(X, Y)
[<matplotlib.lines.Line2D object at 0x000004124CEC0090>]
>>> plt.show()
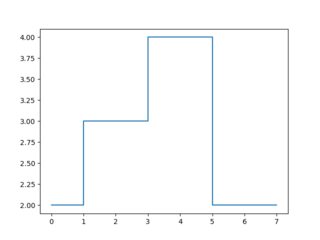
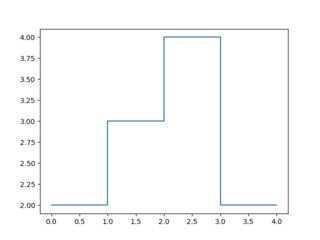
通过给出Y和Y坐标的每个点,就可以明确地请求垂直线:
>>> X = [0, 1, 1, 2, 2, 3, 3, 4]
>>> Y = [2, 2, 3, 3, 4, 4, 2, 2]
>>> plt.plot(X, Y)
[<matplotlib.lines.Line2D object at 0x000004124CEC0090>]
>>> plt.show()
若要只绘制水平线或仅绘制垂直线,请分别使用matplotlib的hlines或vlines。
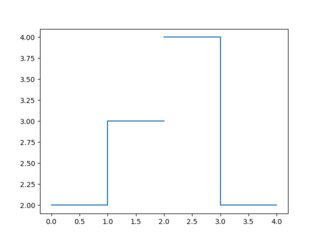
要避免绘制线段吗?南的没有联系:
>>> X = [0, 1, 1, 2,      2,       2, 3, 3, 4]
>>> Y = [2, 2, 3, 3, float('NaN'), 4, 4, 2, 2]
>>> plt.plot(X, Y)
[<matplotlib.lines.Line2D object at 0x0000016250A0C060>]
>>> plt.show()
要回答为什么线段在默认情况下不是垂直的:因为分段线性图比分段常量图(直观地)更接近现实生活中的函数。
比较

与

Stack Overflow用户
发布于 2017-05-11 20:13:31
有人能解释一下为什么这包括一个斜坡而不是简单的跳跃吗?
因为(在你的图中)在x=2的剪切值是0,而在x=3是-4。连接它的唯一方法是用一条“斜线”--低音线,其中x和剪切值的变化是三角形的另外两个边。
如果这条线是垂直的,剪切必须与x=2的值0和-4同时,这是不可能的(在非量子物理学中:D)。
正如注释中正确指出的那样,要使这一行显示为垂直,就必须提高分辨率--有更多的x数据点。
https://stackoverflow.com/questions/43924375
复制相似问题
腾讯云开发者

Copyright © 2013 - 2026 Tencent Cloud. All Rights Reserved. 腾讯云 版权所有
深圳市腾讯计算机系统有限公司 ICP备案/许可证号:粤B2-20090059 ![]() 粤公网安备44030502008569号
粤公网安备44030502008569号
腾讯云计算(北京)有限责任公司 京ICP证150476号 | 京ICP备11018762号